

The story (IP) has become the best performing asset in the market, surging nearly 25% in the last 24 hours. This double-digit increase has pushed IP up to the upper trend line of the descending parallel channel.
This trend line has been keeping the altcoin's price in a downtrend since it reached an all-time high of $9 on February 21st. Successfully breaking above this level could lead to further upside.
IP, Bullish Breakout in Focus
IP's value reached an all-time high of $9 four days ago, but has since declined by around 45%. It is currently trading at $5.01, with the overall price fluctuating within the parallel channel.
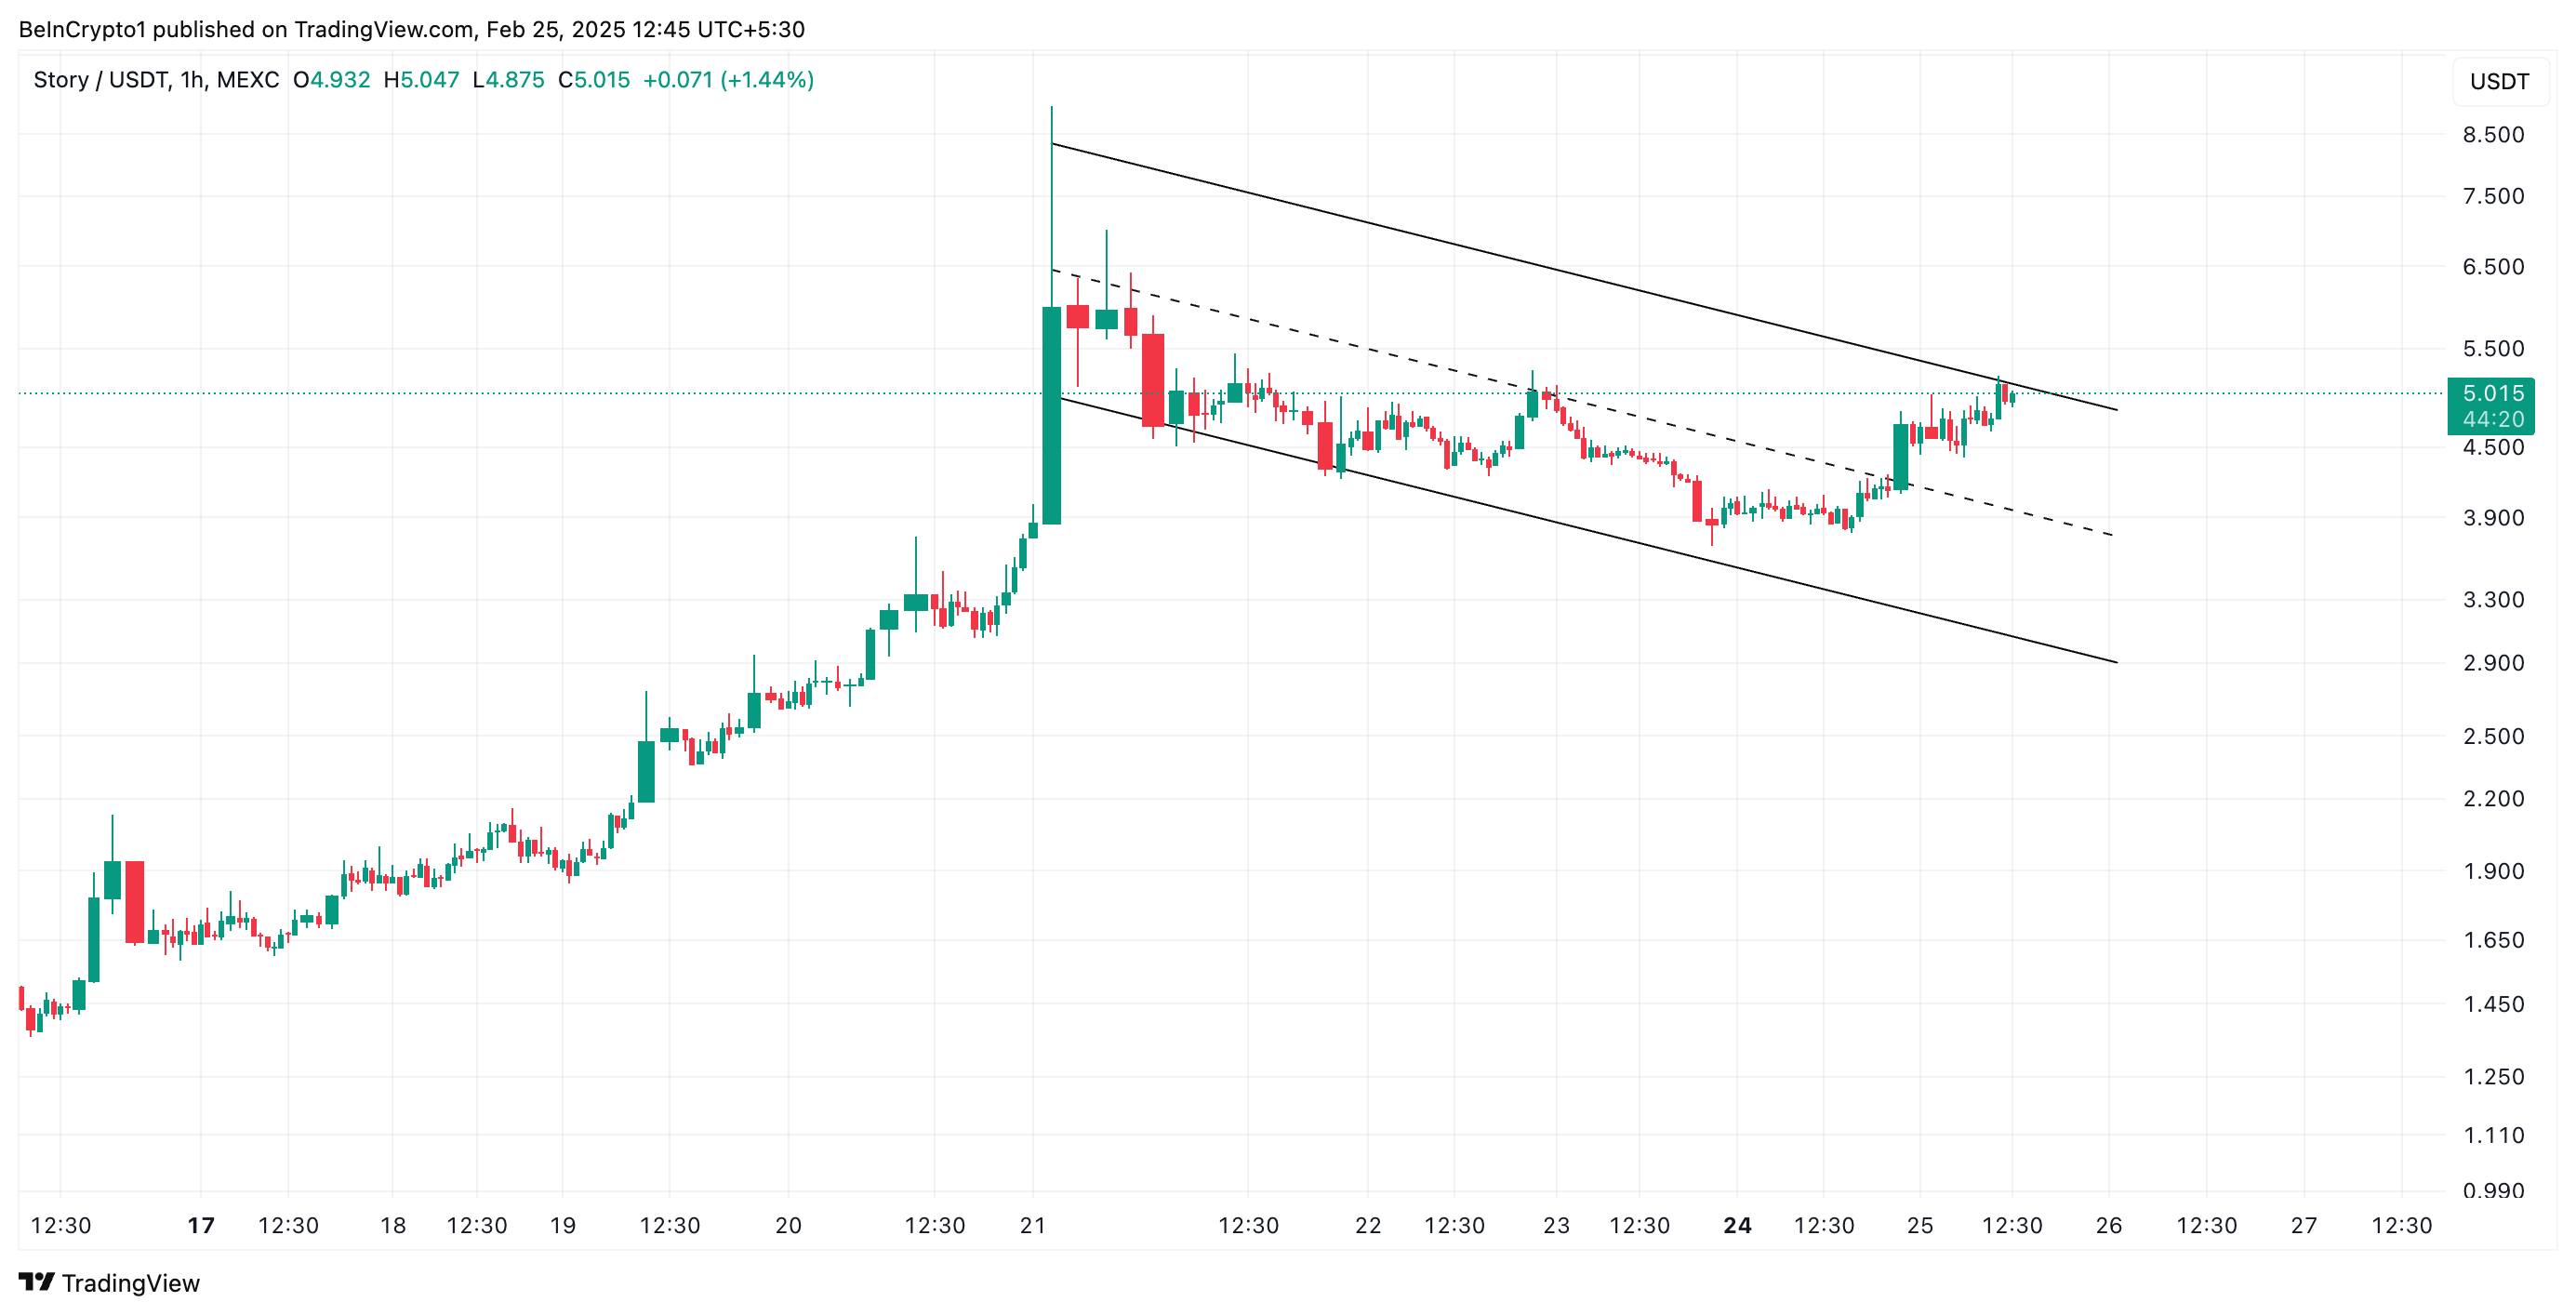
This pattern forms when an asset's price moves between two downward-sloping parallel trend lines, indicating a persistent downtrend with lower highs and lower lows. When an asset trades within this channel, it suggests ongoing selling pressure as demand decreases.
However, as demand for IP has started to increase, it is now poised to break above the upper trend line of this channel. This indicates that buying pressure has started to overcome selling resistance among IP holders, and the altcoin is preparing for a sustained uptrend.
The setup of the Moving Average Convergence Divergence (MACD) confirms the possibility of this bullish breakout. At the time of reporting, IP's MACD line (blue) is positioned above the signal line (orange).
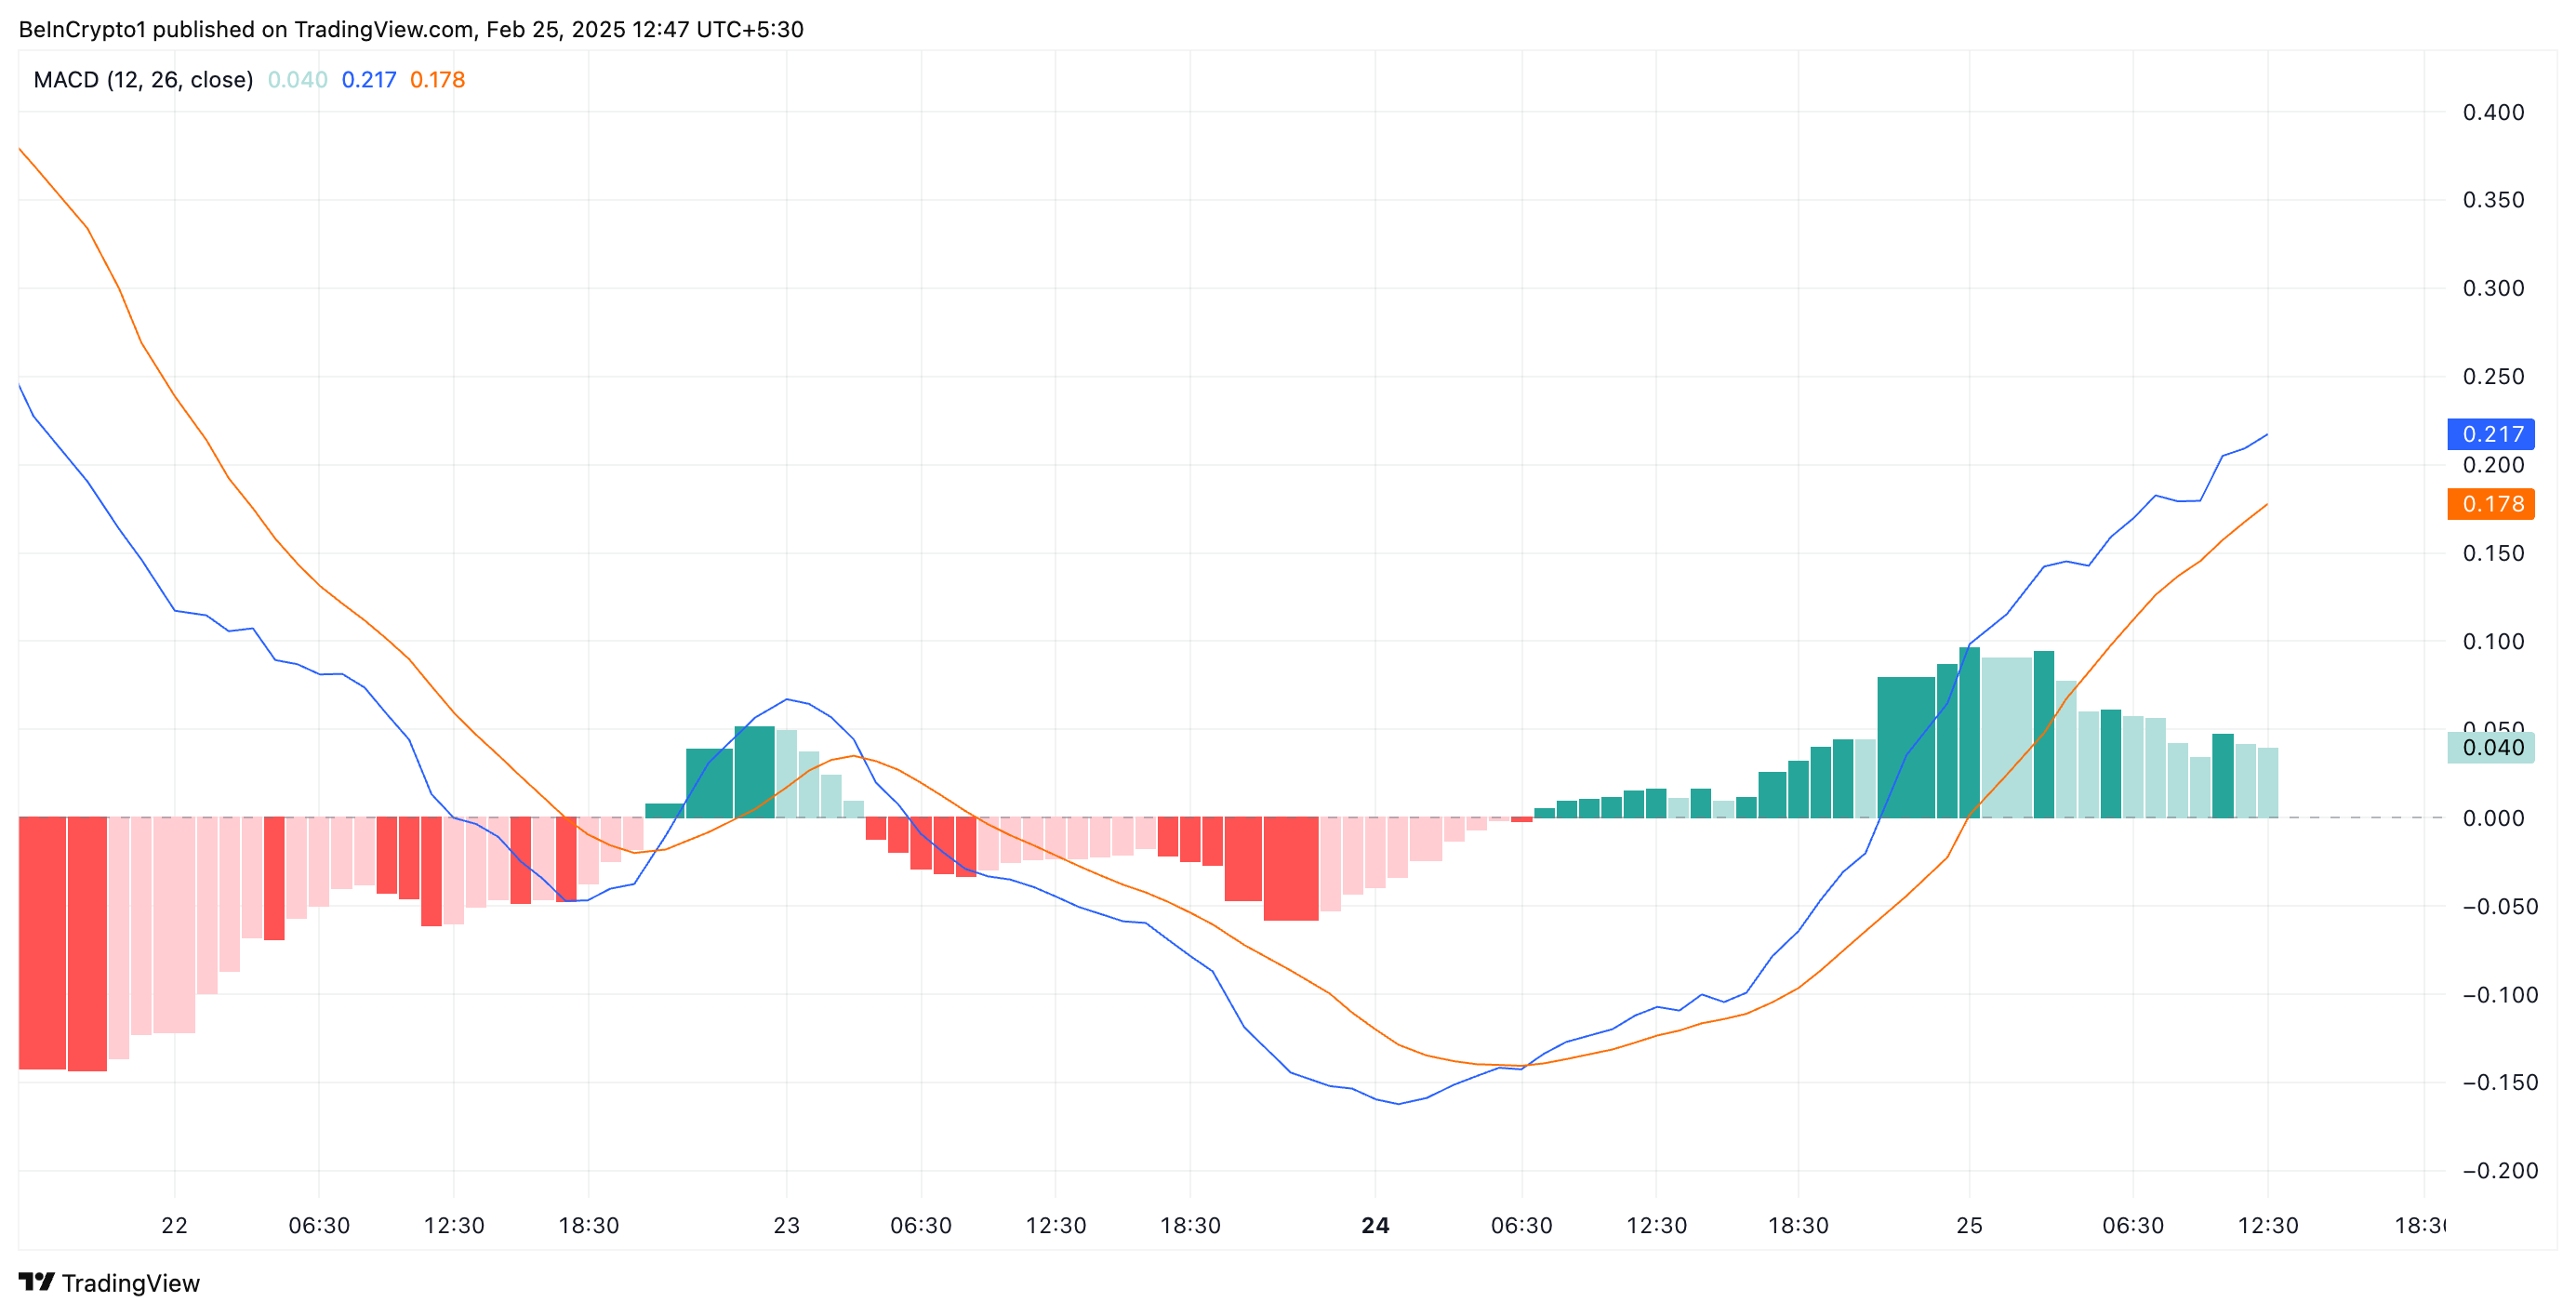
With this momentum indicator set up in this manner, it suggests substantial bullish pressure in the market, and that the asset's price can continue to rise.
Specifically, IP bulls have regained market dominance, as reflected in the Elder-Ray Index. This indicator measures the strength of an asset's bullish/bearish forces, and it is currently positioned at 0.40 at the time of reporting.
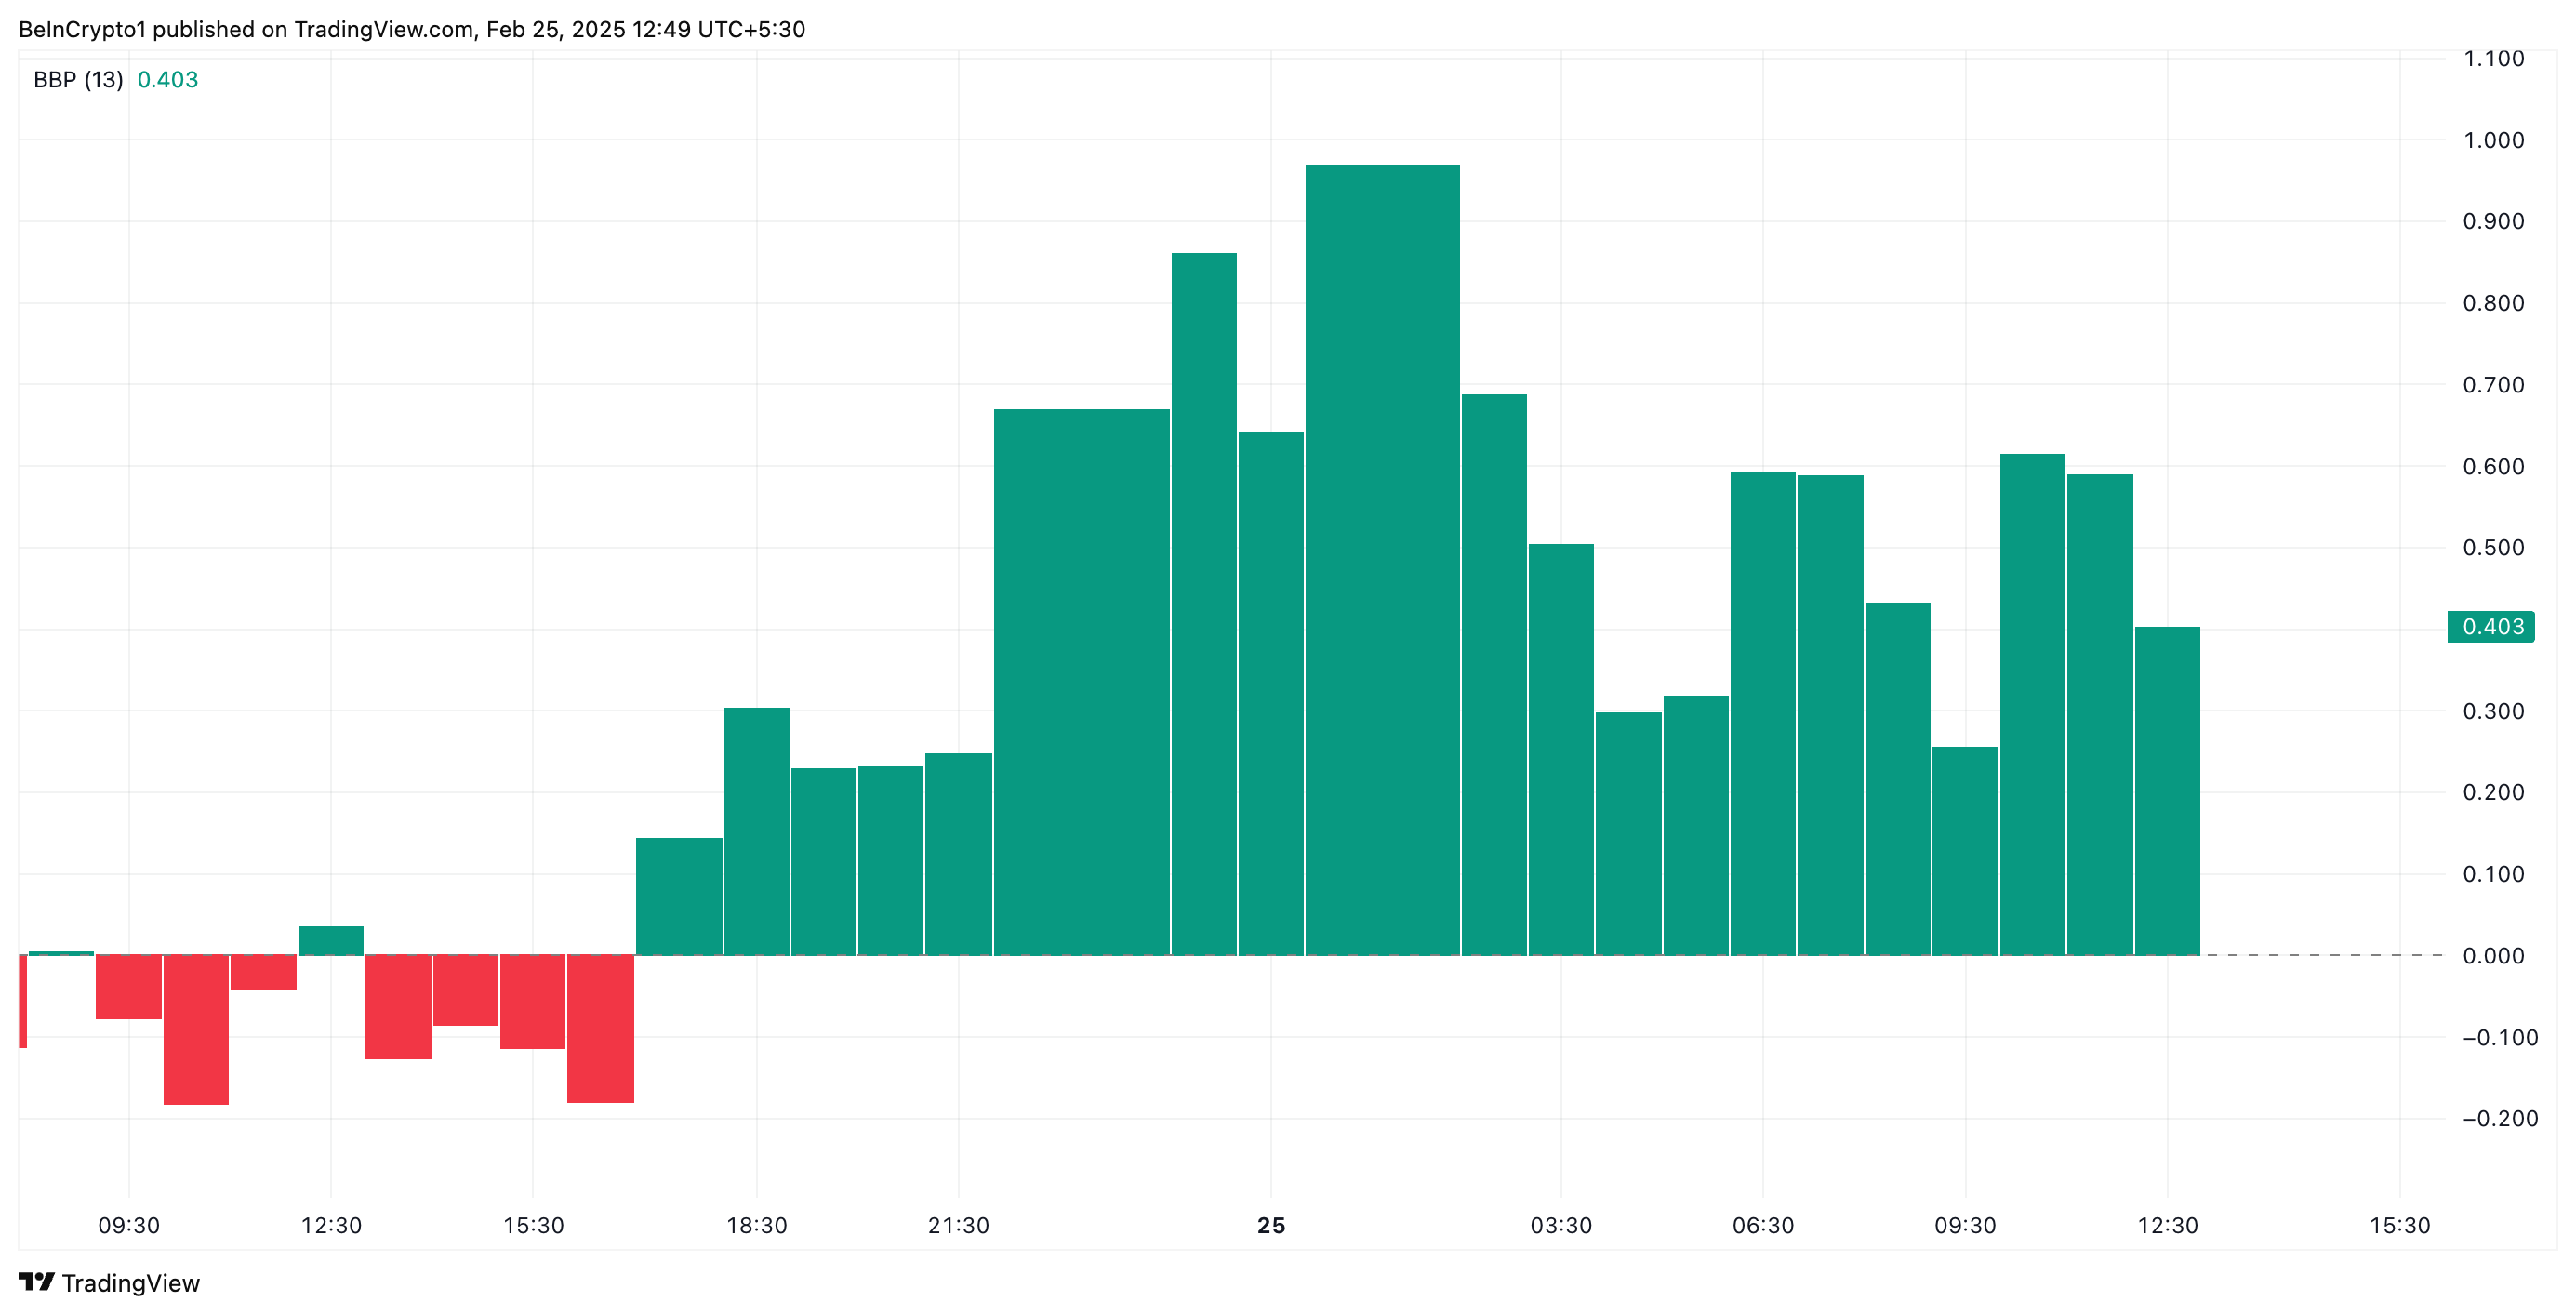
IP Elder-Ray Index. Source: TradingView
When this value is positive, it indicates that the bulls are in control, and the asset is trading above its Exponential Moving Average (EMA), signaling strong buying pressure.
Can IP's Bullishness Push It to $9?
Successfully breaking above this upper trend line will confirm the strength of IP's current uptrend. In this case, the price can break through the $6 resistance and potentially reach the all-time high of $9.
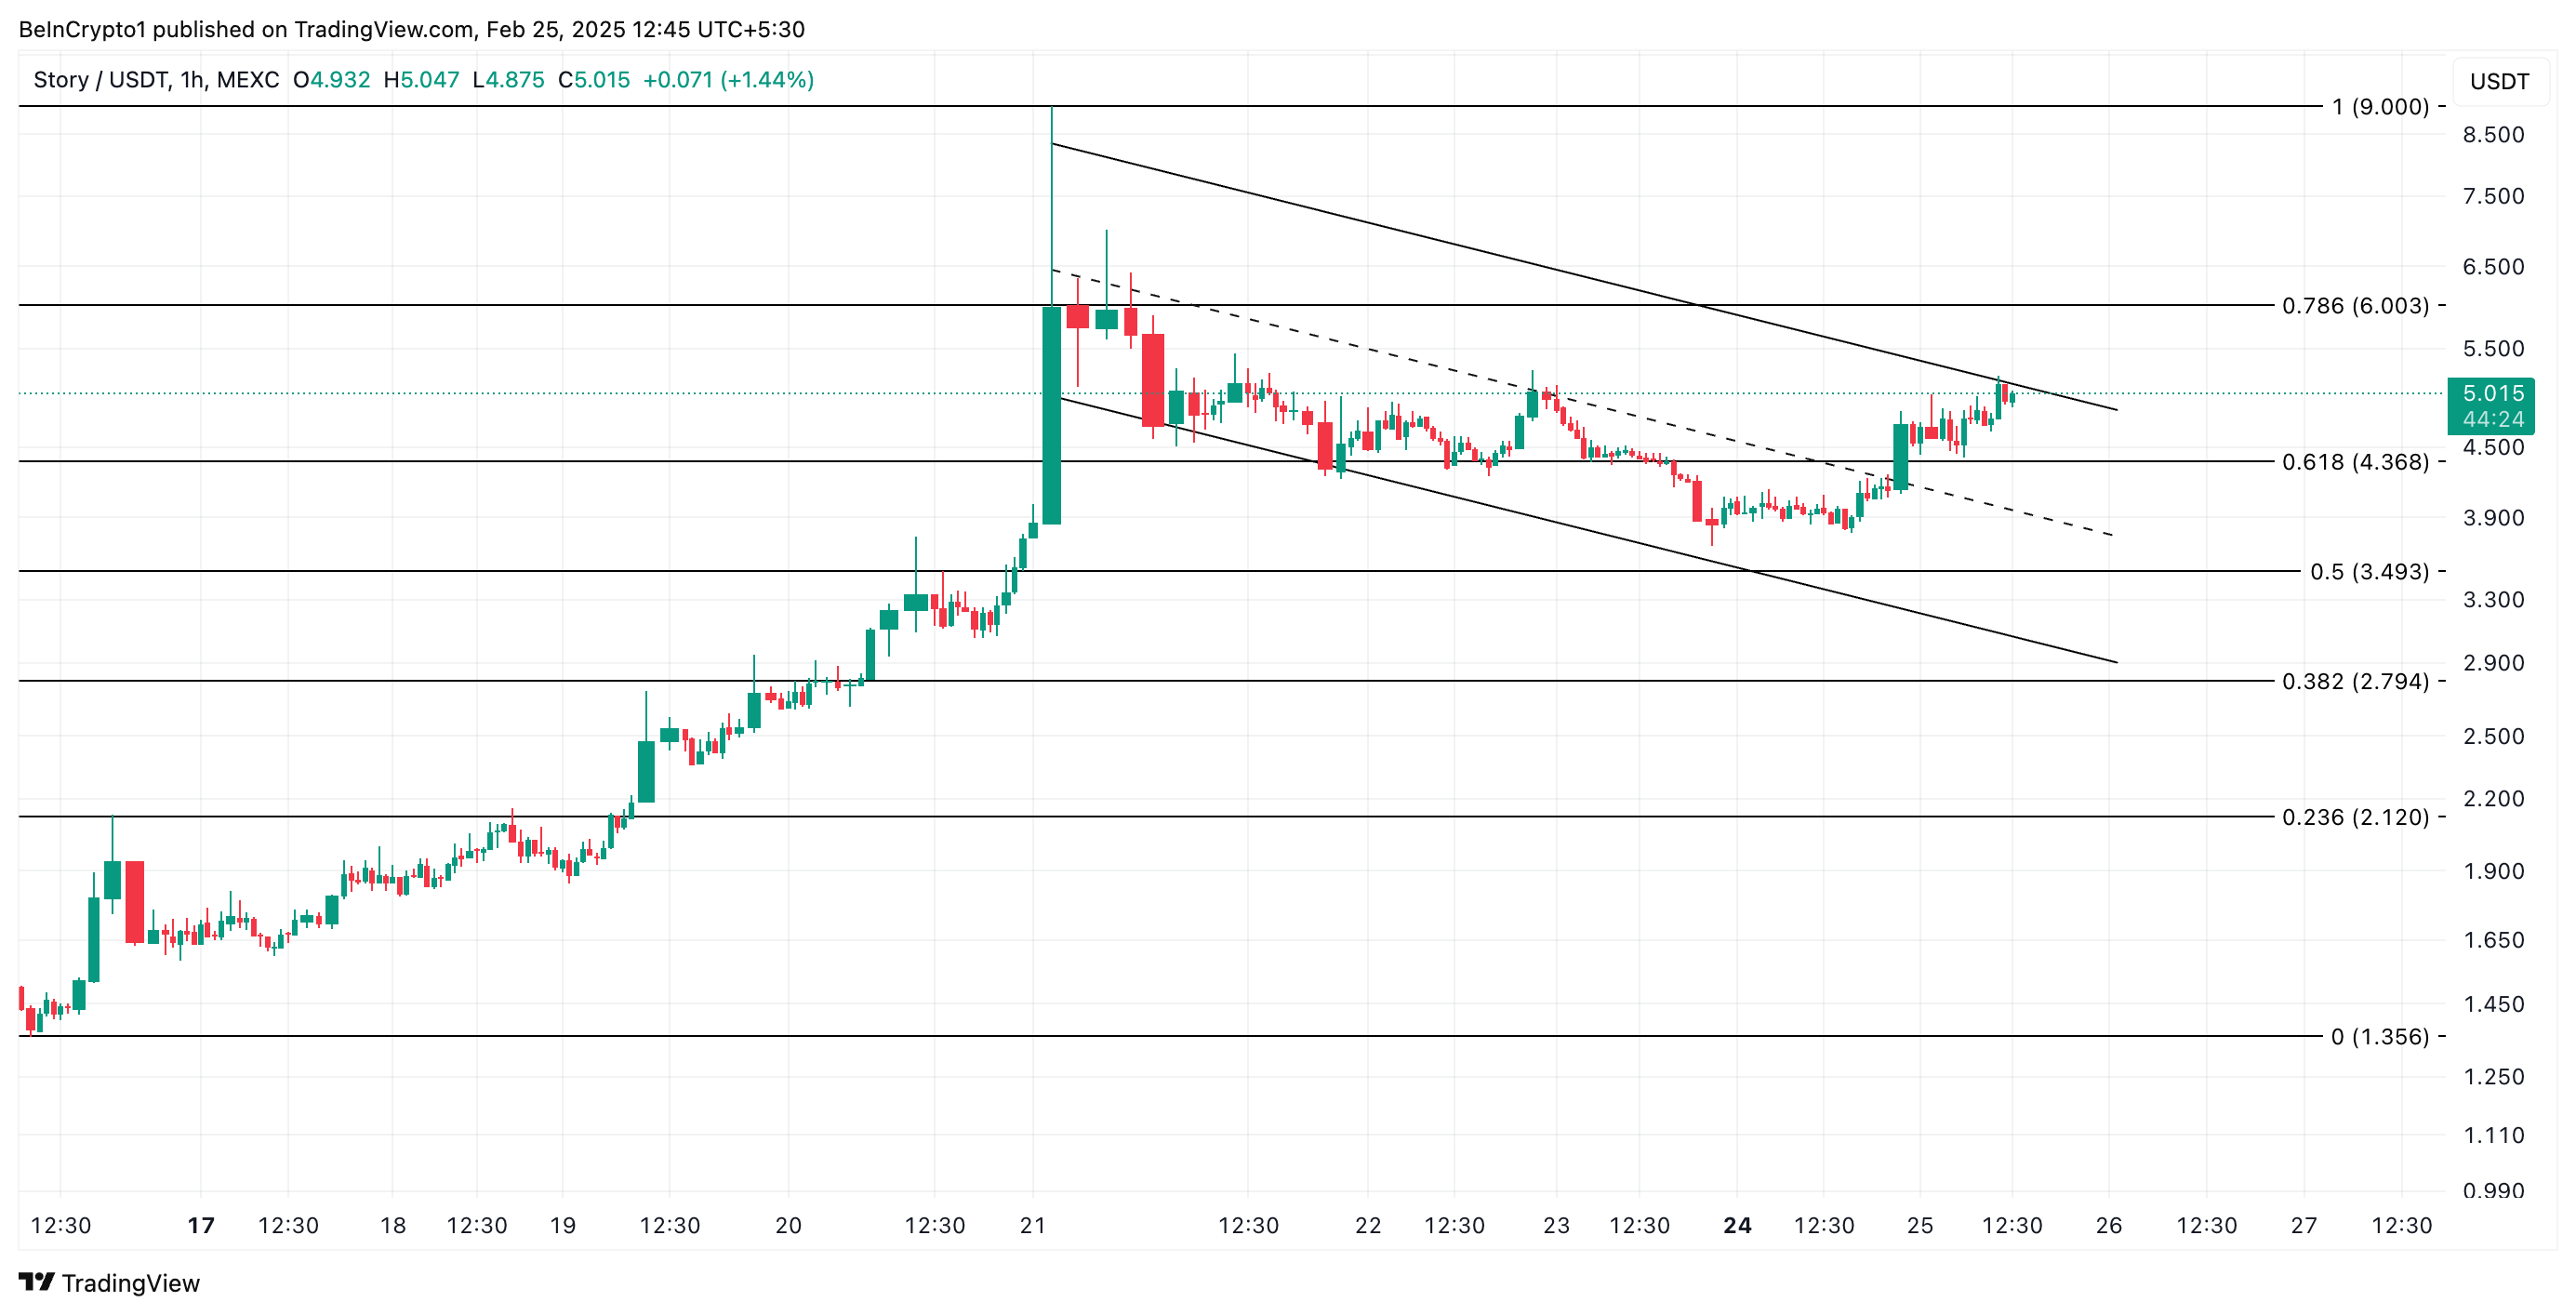
Conversely, if selling activity resumes, IP risks losing its recent gains and could potentially drop to $4.36.
If the bulls fail to defend this support level, IP's price could further decline towards the lower trend line of the descending parallel channel.


