

Bit(BTC) has faced significant downward pressure over the past week. For the first time since November 2024, the price has fallen below $90,000. It has declined 11% over the past 7 days and is currently trading near the crucial $85,985 support level.
Technical indicators are mostly showing bearish signals. The red cloud is currently positioned above the current price and is slightly widening, indicating an increase in downward momentum. Despite this short-term weakness, some analysts point to signs of recovery as the short-term moving averages have started to turn upward.
Bit Ichimoku Cloud Signals Weakness
Bit's Ichimoku Cloud is mostly displaying a bearish trend. The red cloud (Kumo) is currently above the price, indicating a resistance zone that Bit needs to break through to reverse the trend. The cloud is slightly widening, suggesting an increase in downward momentum.
The leading Span A (green line) being below the leading Span B (red line) further confirms the bearish outlook. Additionally, the price is trading below the blue Conversion line and red Base line, implying the short-term trend is still under downward pressure.
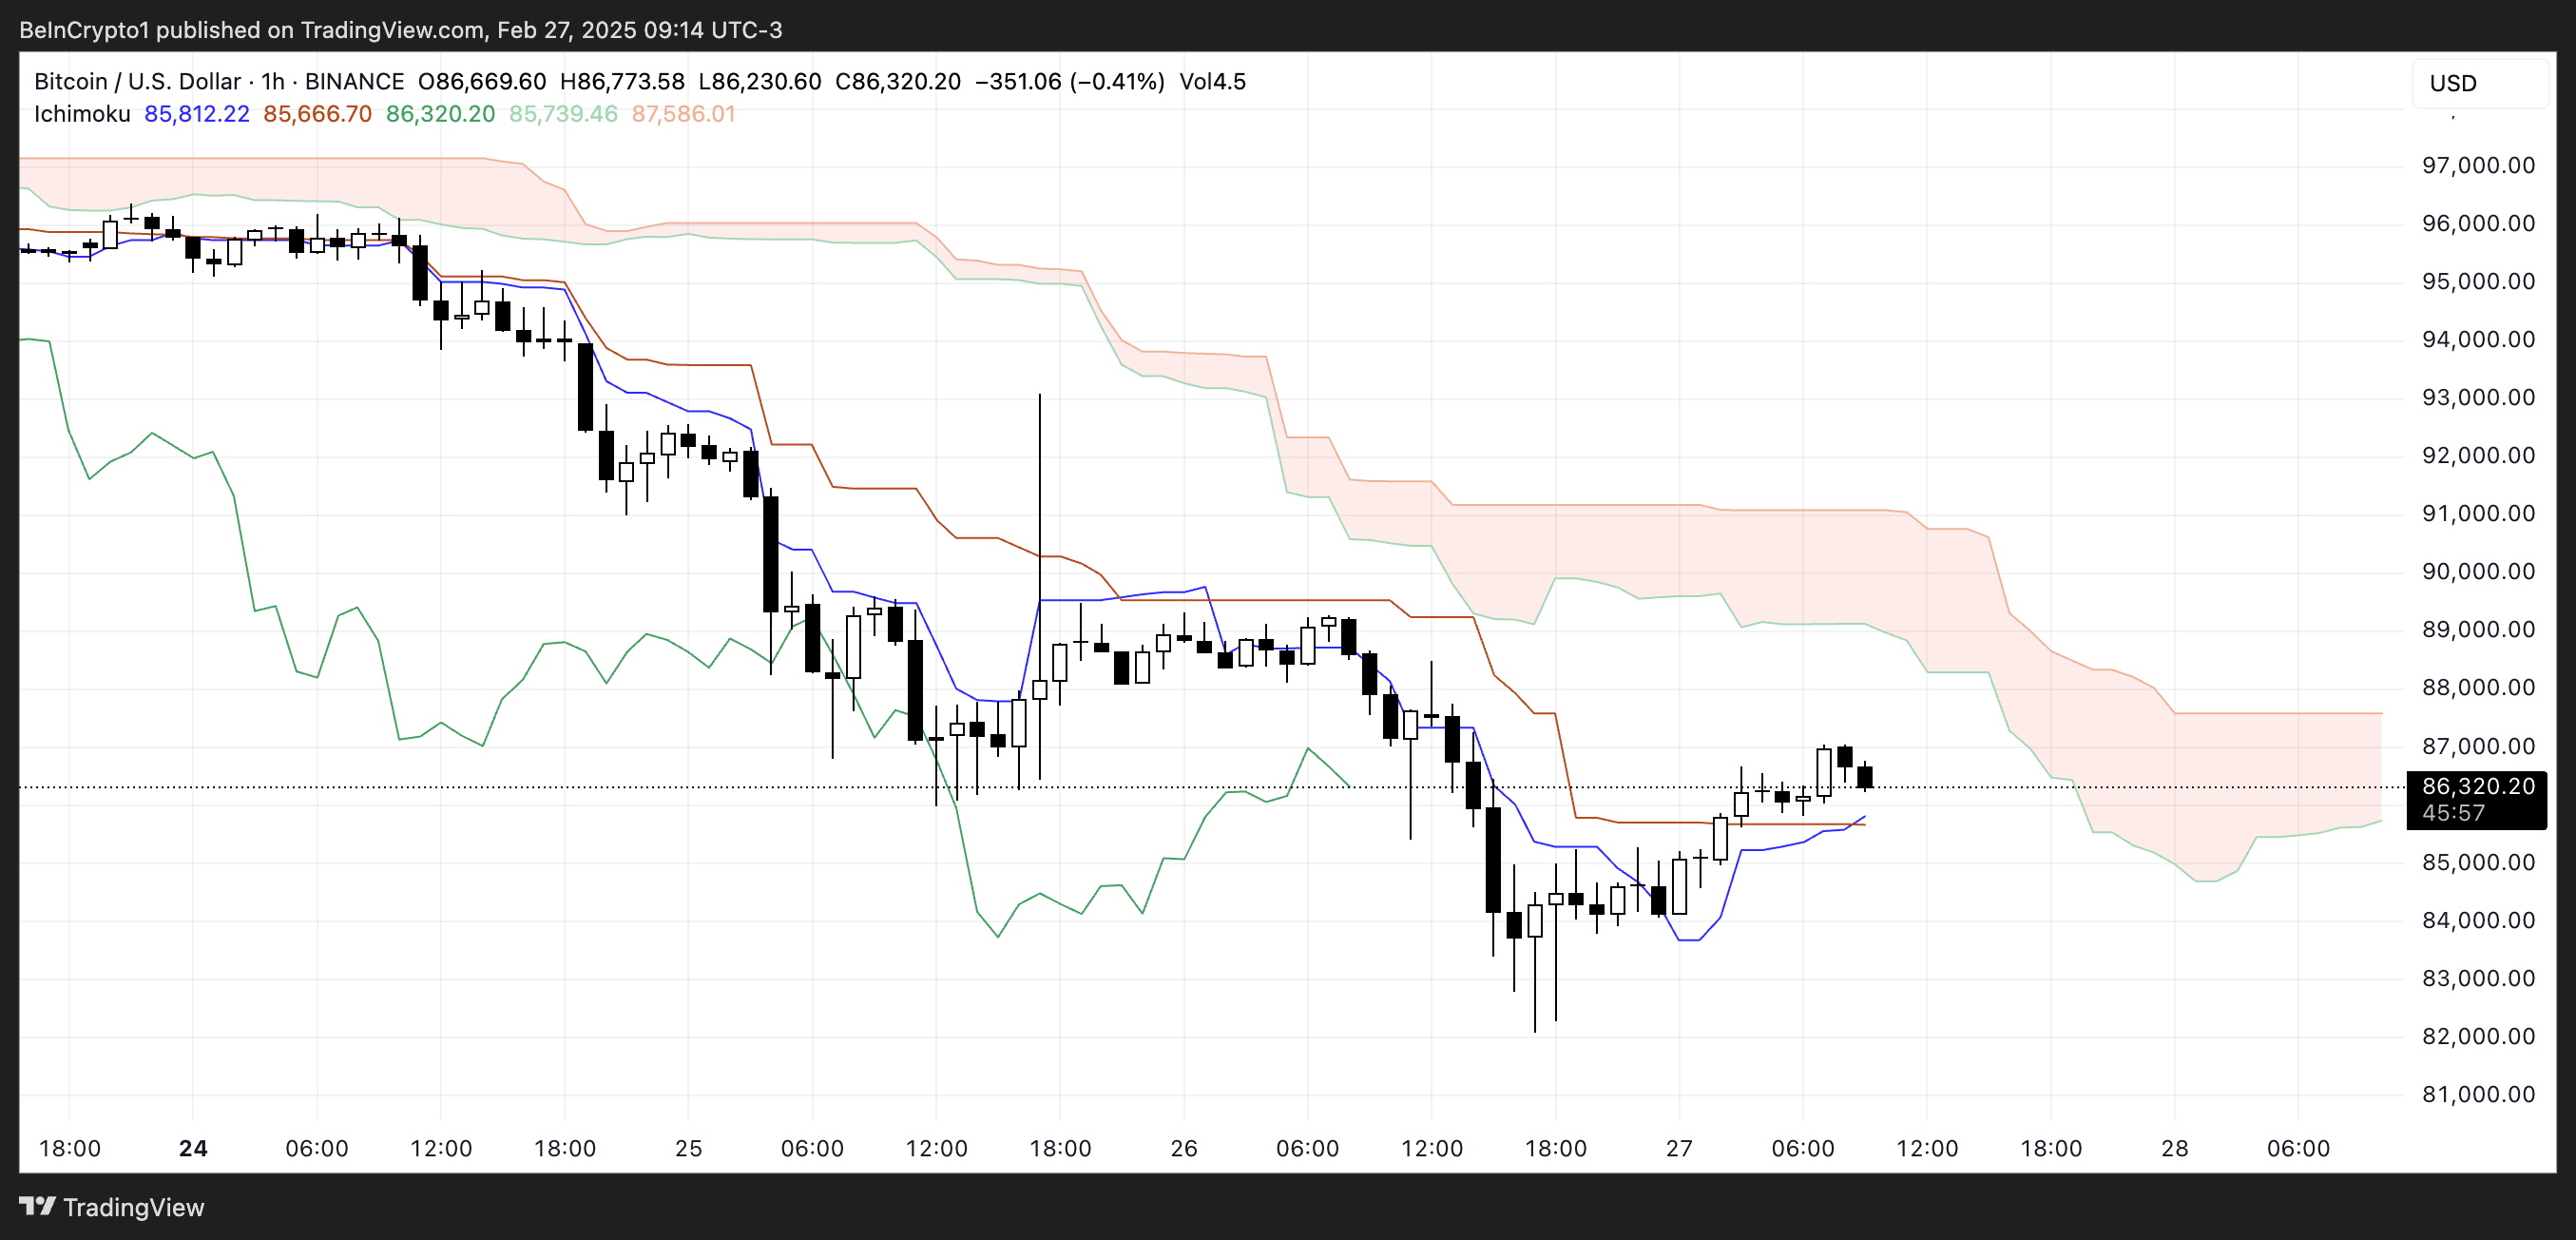
The Conversion line has started to flatten, which generally indicates a temporary pause or correction in the downtrend. However, it is still below the Base line, reinforcing the bearish bias.
The green Chikou Span (lagging line) being below the price action and the cloud supports the continuation of the downtrend. Overall, unless Bit breaks above the cloud resistance and the Conversion line crosses above the Base line, the downward momentum is likely to persist.
Bit Whales Decrease in the Past 5 Days
The number of Bit whales, defined as addresses holding at least 1,000 BTC, peaked at 2,054 on February 22 and has been steadily increasing.
However, this metric has started to decrease since then, and currently, there are 2,042 whale addresses.
Tracking these large holders is important for market participants. Whales possess significant market-moving power, and their accumulation or distribution patterns often precede major price movements. Their concentration levels provide insights into the distribution of Bit's wealth and the overall health of the network.
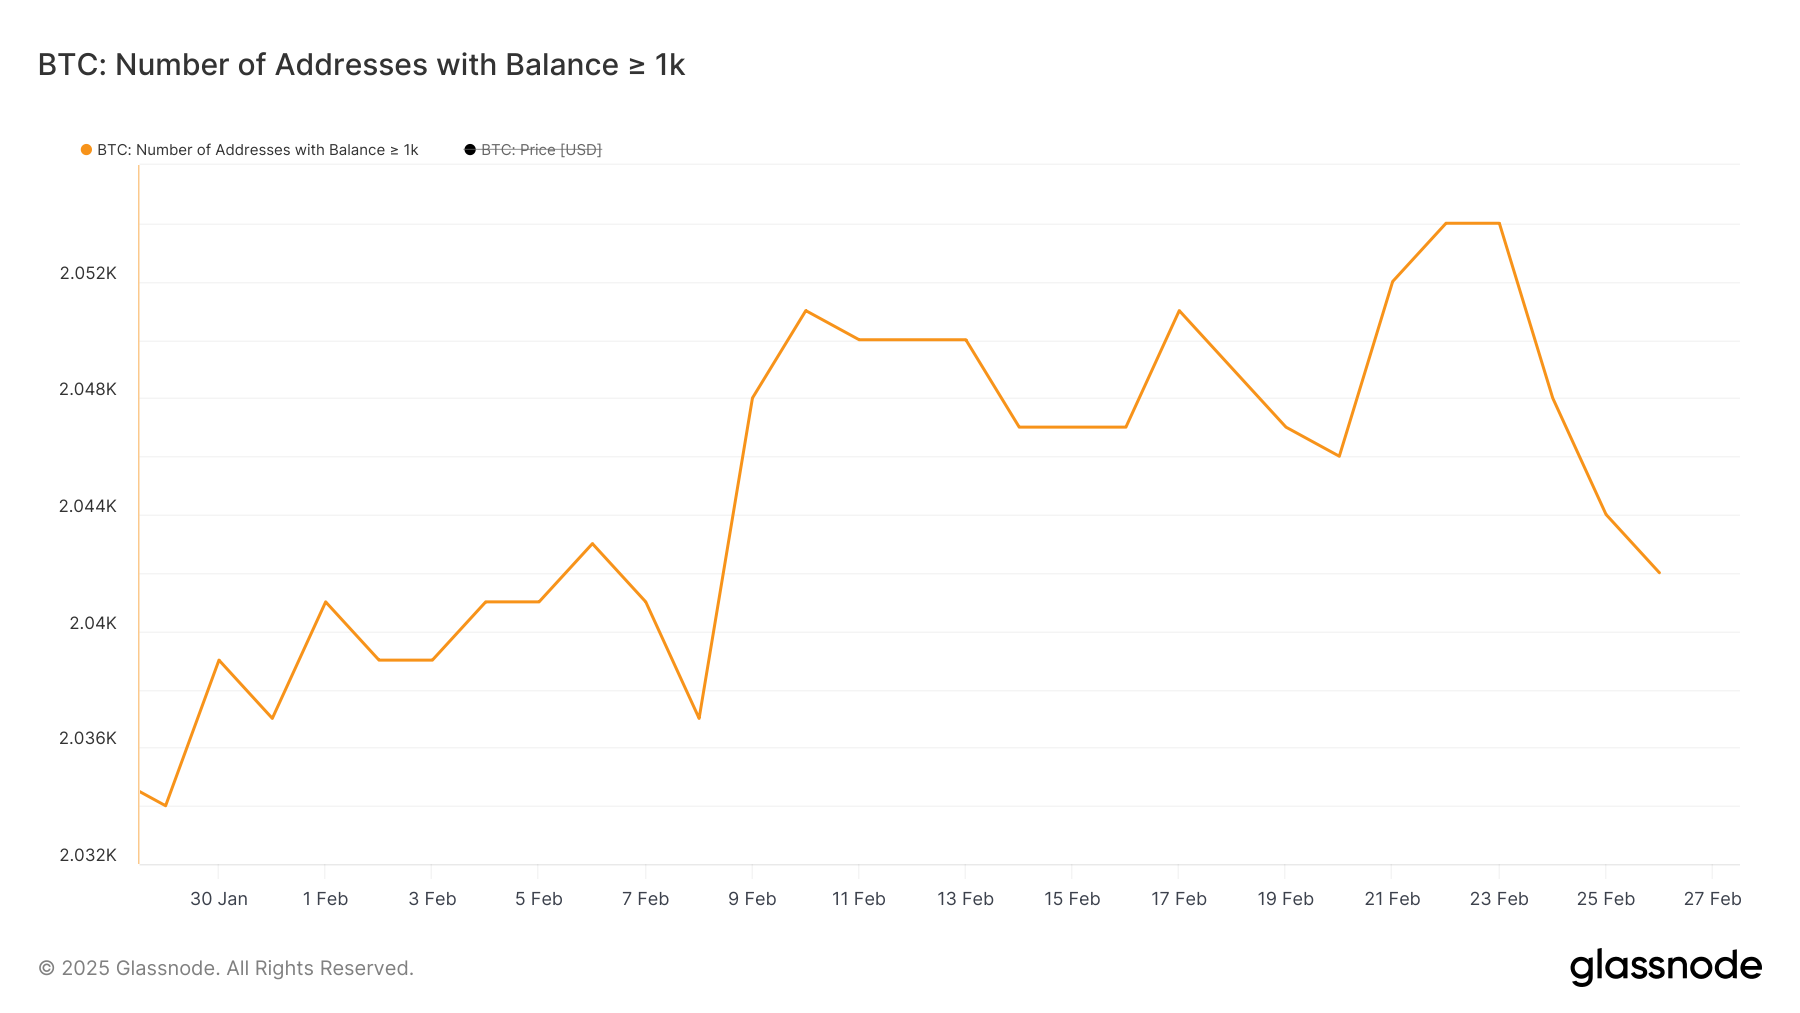
The recent decrease in whale addresses may indicate short-term selling pressure. These large holders may be realizing profits or redistributing their holdings across multiple wallets for security, which could contribute to short-term price volatility or downward pressure.
Despite this recent decrease, the current 2,042 whale count is still historically high compared to previous years. This suggests the continued interest of strong institutional and high-net-worth individuals in viewing Bit as a long-term store of value. According to Tracy Jin, the COO of MEXC:
"The long-term trend remains unchanged. Institutional demand and the continued strengthening of the Bit infrastructure, including ETFs and new investment products, are further solidifying its position. However, the short-term outlook is still under pressure. The market is going through a phase of excessive leverage liquidation and risk appetite reduction. While this is beneficial for the long-term healthy development of Bit," Jin told BeInCrypto.
Can Bit Recover Above $90,000?
Bit currently has an important resistance level at $85,985. Failing to hold this support could lead to a drop to the $82,000 range, and the current correction may continue.
As the market approaches this resistance level, tension is building among traders who are closely watching for directional cues in this volatile market.
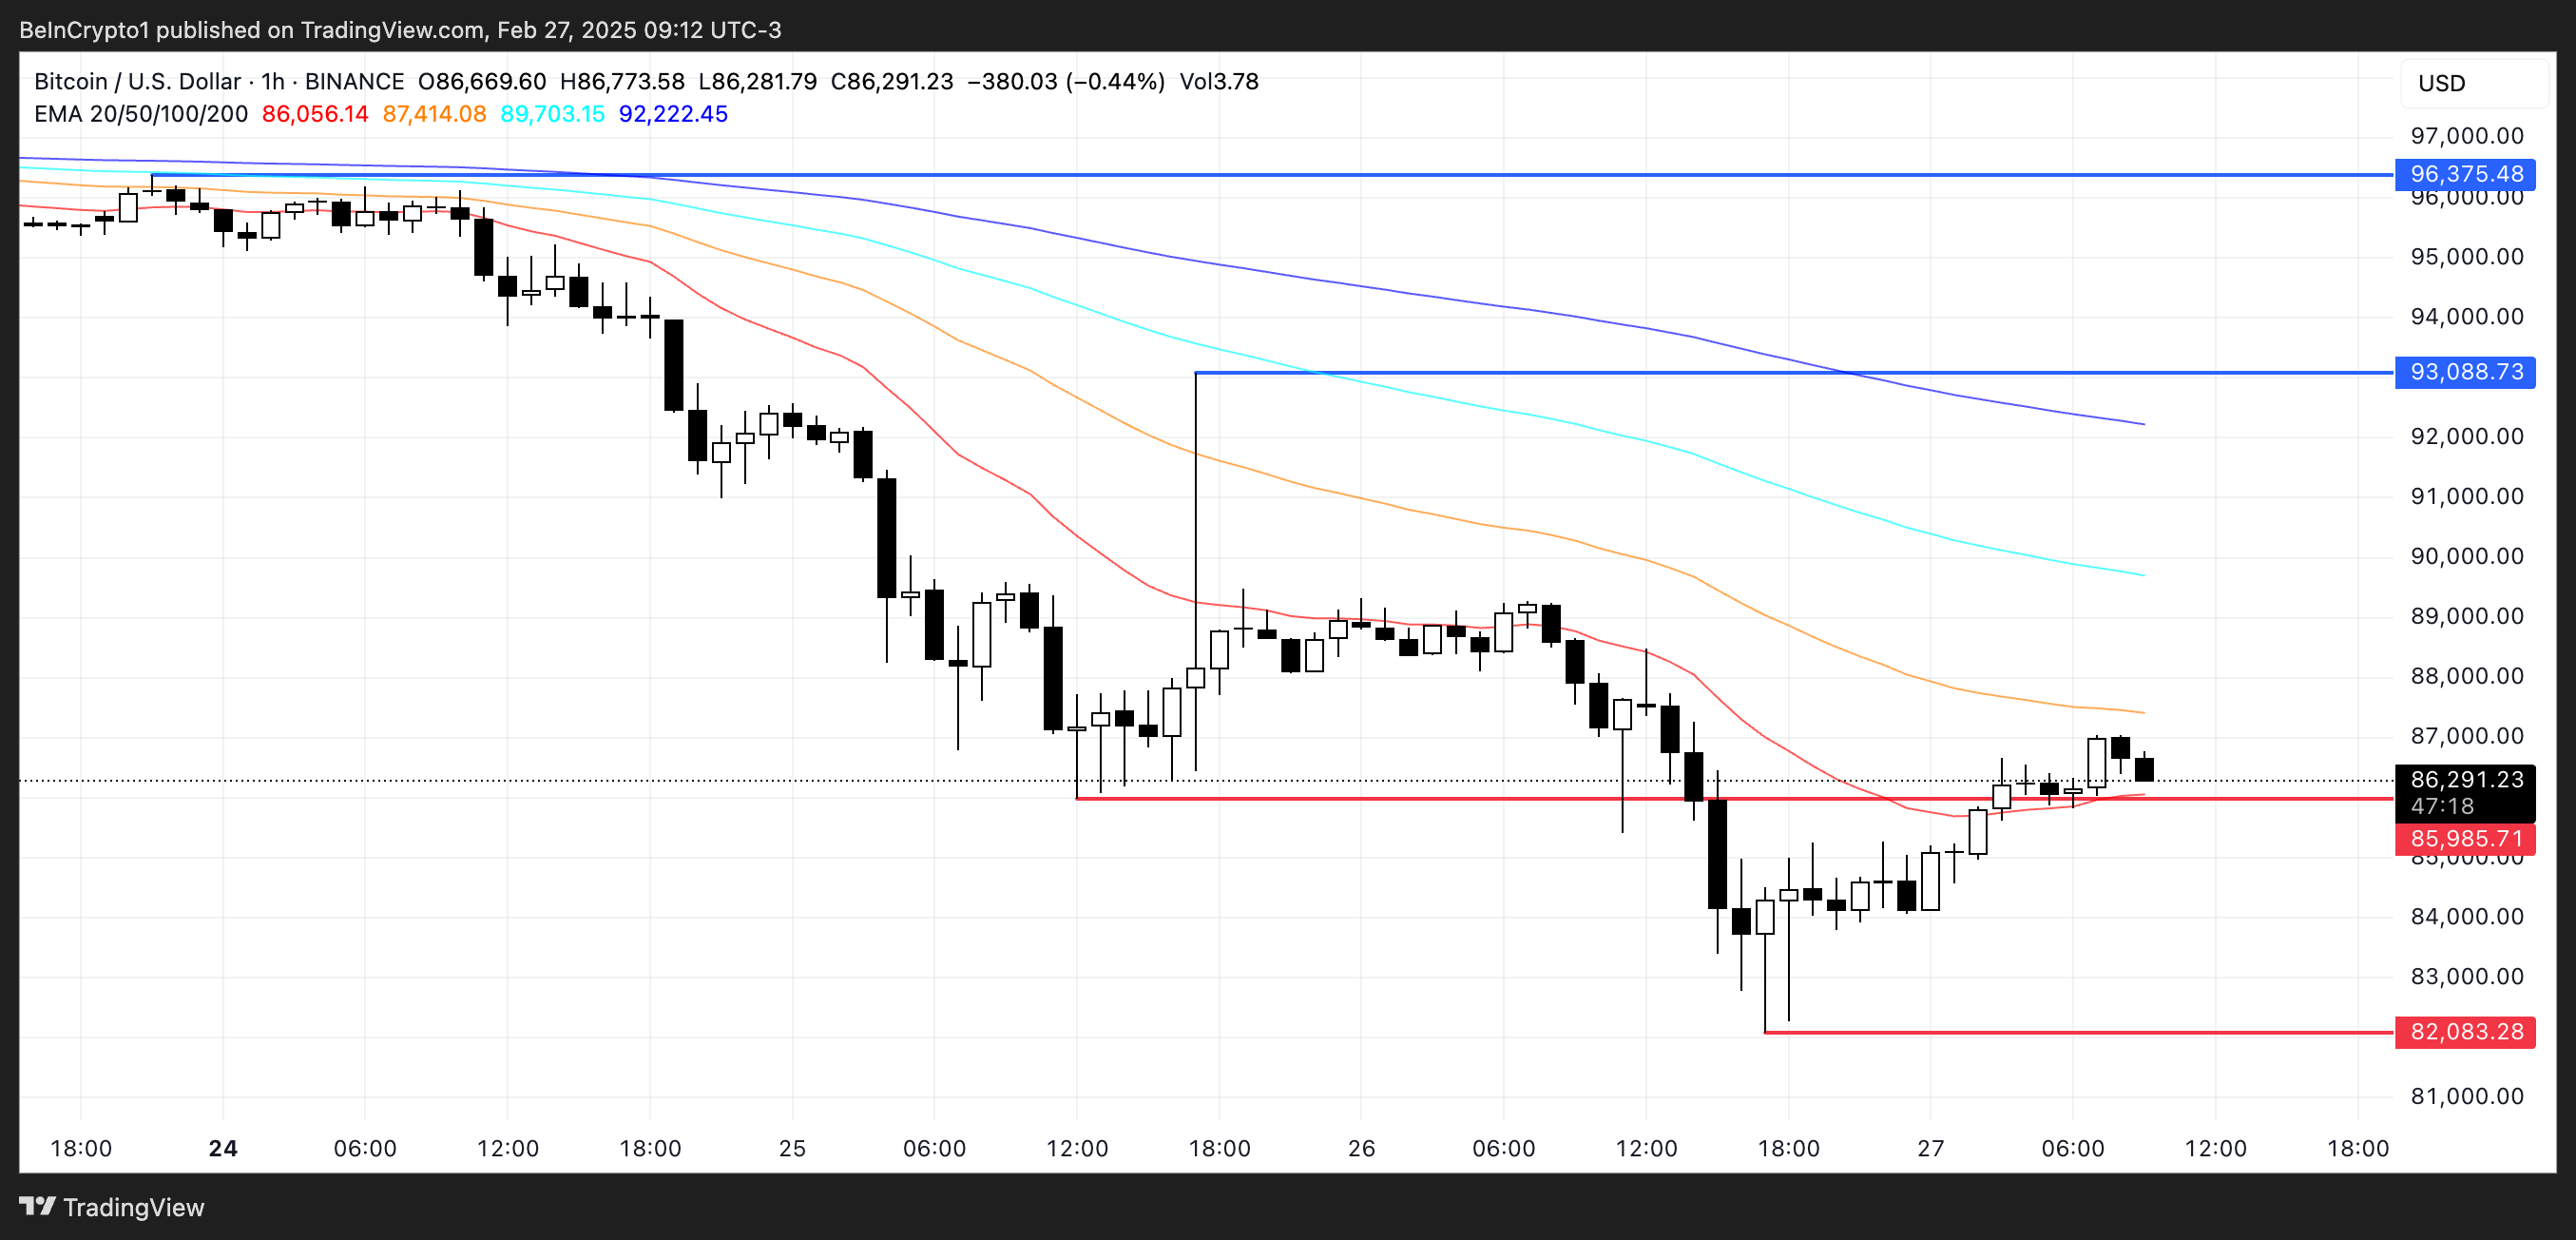
The moving average (EMA) structure of Bit is currently displaying a downward trend. While the short-term indicators are positioned below the long-term ones, there are potential signs of optimism.
"Despite the current decline, the long-term trajectory of Bit remains strong. Institutional investors continue to increase their Bit positions, and the development of the Bit infrastructure (including new ETFs and payment solutions) is further strengthening its status as digital gold. In the short term, the price needs to recover above $96,000-$100,000 to confirm that the market is preparing for a new growth phase. If the pressure persists, the market could enter a deeper correction stage."
Maria Karola, CEO of StealthEx.
The upward trend in the short-term moving averages suggests the possibility of a trend reversal in the near future. If this bullish crossover materializes, Bit's price could gain momentum and challenge the $93,000 resistance.
A breakout at this level could propel the price towards the next major target of $96,375, which could signal the resumption of the broader upward trend that has characterized Bit's recent performance.


