

Ethereum (ETH) is experiencing a sharp correction, falling 11% last week. The bearish momentum continues to dominate. The Relative Strength Index (RSI) still shows weakness, indicating a lack of strong buying pressure. The Directional Movement Index (DMI) confirms that sellers are still in control of the market.
Additionally, the Exponential Moving Average (EMA) is showing a firm bearish structure. This suggests that ETH may soon test the crucial support level of $1,756, and could potentially fall below $1,700 for the first time since October 2023.
ETH RSI, Lack of Buying Pressure
The Ethereum Relative Strength Index (RSI) is currently at 34.4, having briefly dipped to 27.4 yesterday before recovering slightly. The RSI has remained below 50 for 3 consecutive days, indicating that the bearish momentum is still dominant.
The RSI measures the speed and magnitude of recent price changes to evaluate if an asset is in overbought or oversold territory.
Generally, an RSI above 70 suggests an overbought condition and a potential correction, while an RSI below 30 indicates an oversold state and excessive selling pressure, hinting at an impending rebound.

With ETH's RSI currently at 34.4, the asset remains in the bearish zone, but the extreme selling pressure seen yesterday has eased slightly.
The brief dip below 30 indicated an oversold condition, which often leads to a short-term relief rally. However, for ETH to regain bullish momentum, the RSI needs to rise above 50, signaling a shift in market sentiment.
Until then, any upward moves may face resistance, and the overall trend will remain bearish unless sustained buying pressure can push ETH out of this weak zone.
Ethereum DMI, Downtrend Strengthens
The Ethereum Directional Movement Index (DMI) chart shows that the Average Directional Index (ADX) is currently at 29.82, up from 21.9 yesterday.
ADX measures the strength of a trend, with values above 25 indicating a strong trend and below 20 suggesting a weak or non-existent trend. The sharp increase in ADX confirms that the ongoing downtrend in ETH is strengthening.
The +DI (Positive Directional Index) has declined from 23.1 to 15.4 over the past day, while the -DI (Negative Directional Index) has surged from 27.3 to 37.8. This reinforces the dominance of sellers in the market.
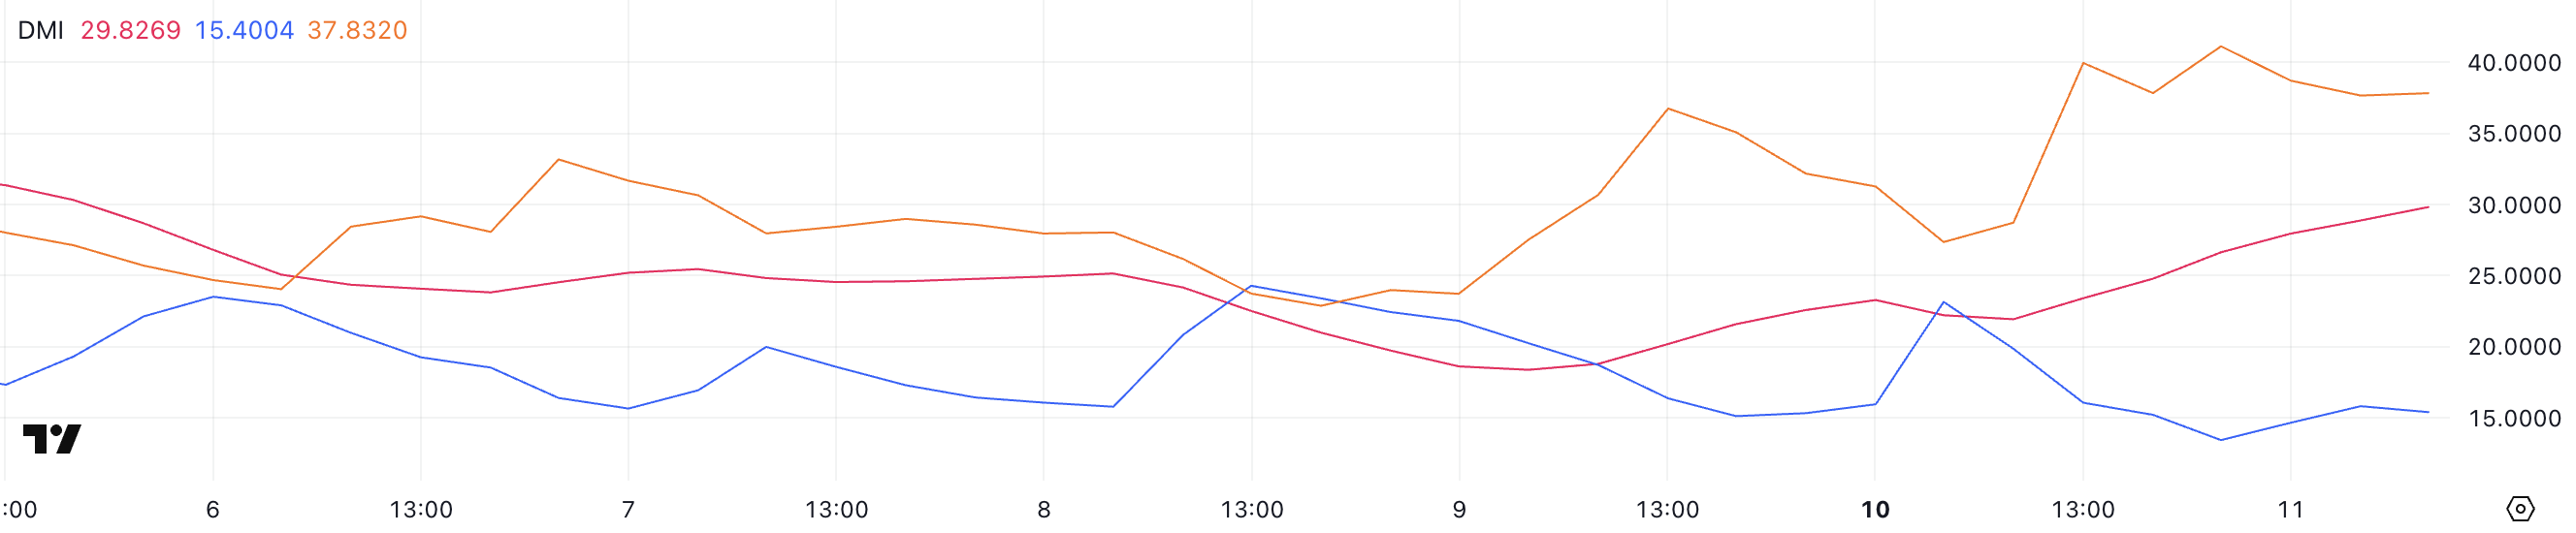
With the -DI significantly higher than the +DI, the bearish momentum is strengthening, and sellers continue to dominate the price action of ETH.
The decline in +DI suggests that buying pressure is weakening, making it more difficult for ETH to attempt a recovery. Unless the +DI rises and crosses above the -DI, the price of ETH is likely to face continued pressure.
With the ADX approaching 30 and continuing to rise, the downtrend appears to be well-established. Any short-term relief rallies may face strong resistance before a meaningful trend reversal occurs.
Ethereum Struggles Below $2,000
The Ethereum Exponential Moving Average (EMA) lines are displaying a strong bearish configuration, with the short-term EMA positioned below the long-term EMA.
This alignment confirms the persistence of the downward momentum and indicates that ETH has declined by more than 11% in the past 24 hours. If the current trend persists, ETH may test the crucial support level of $1,756, which could determine if further downside is imminent.
A break below this support level could push Ethereum's price below $1,700, a level not seen since October 2023, further strengthening the market's bearish sentiment.
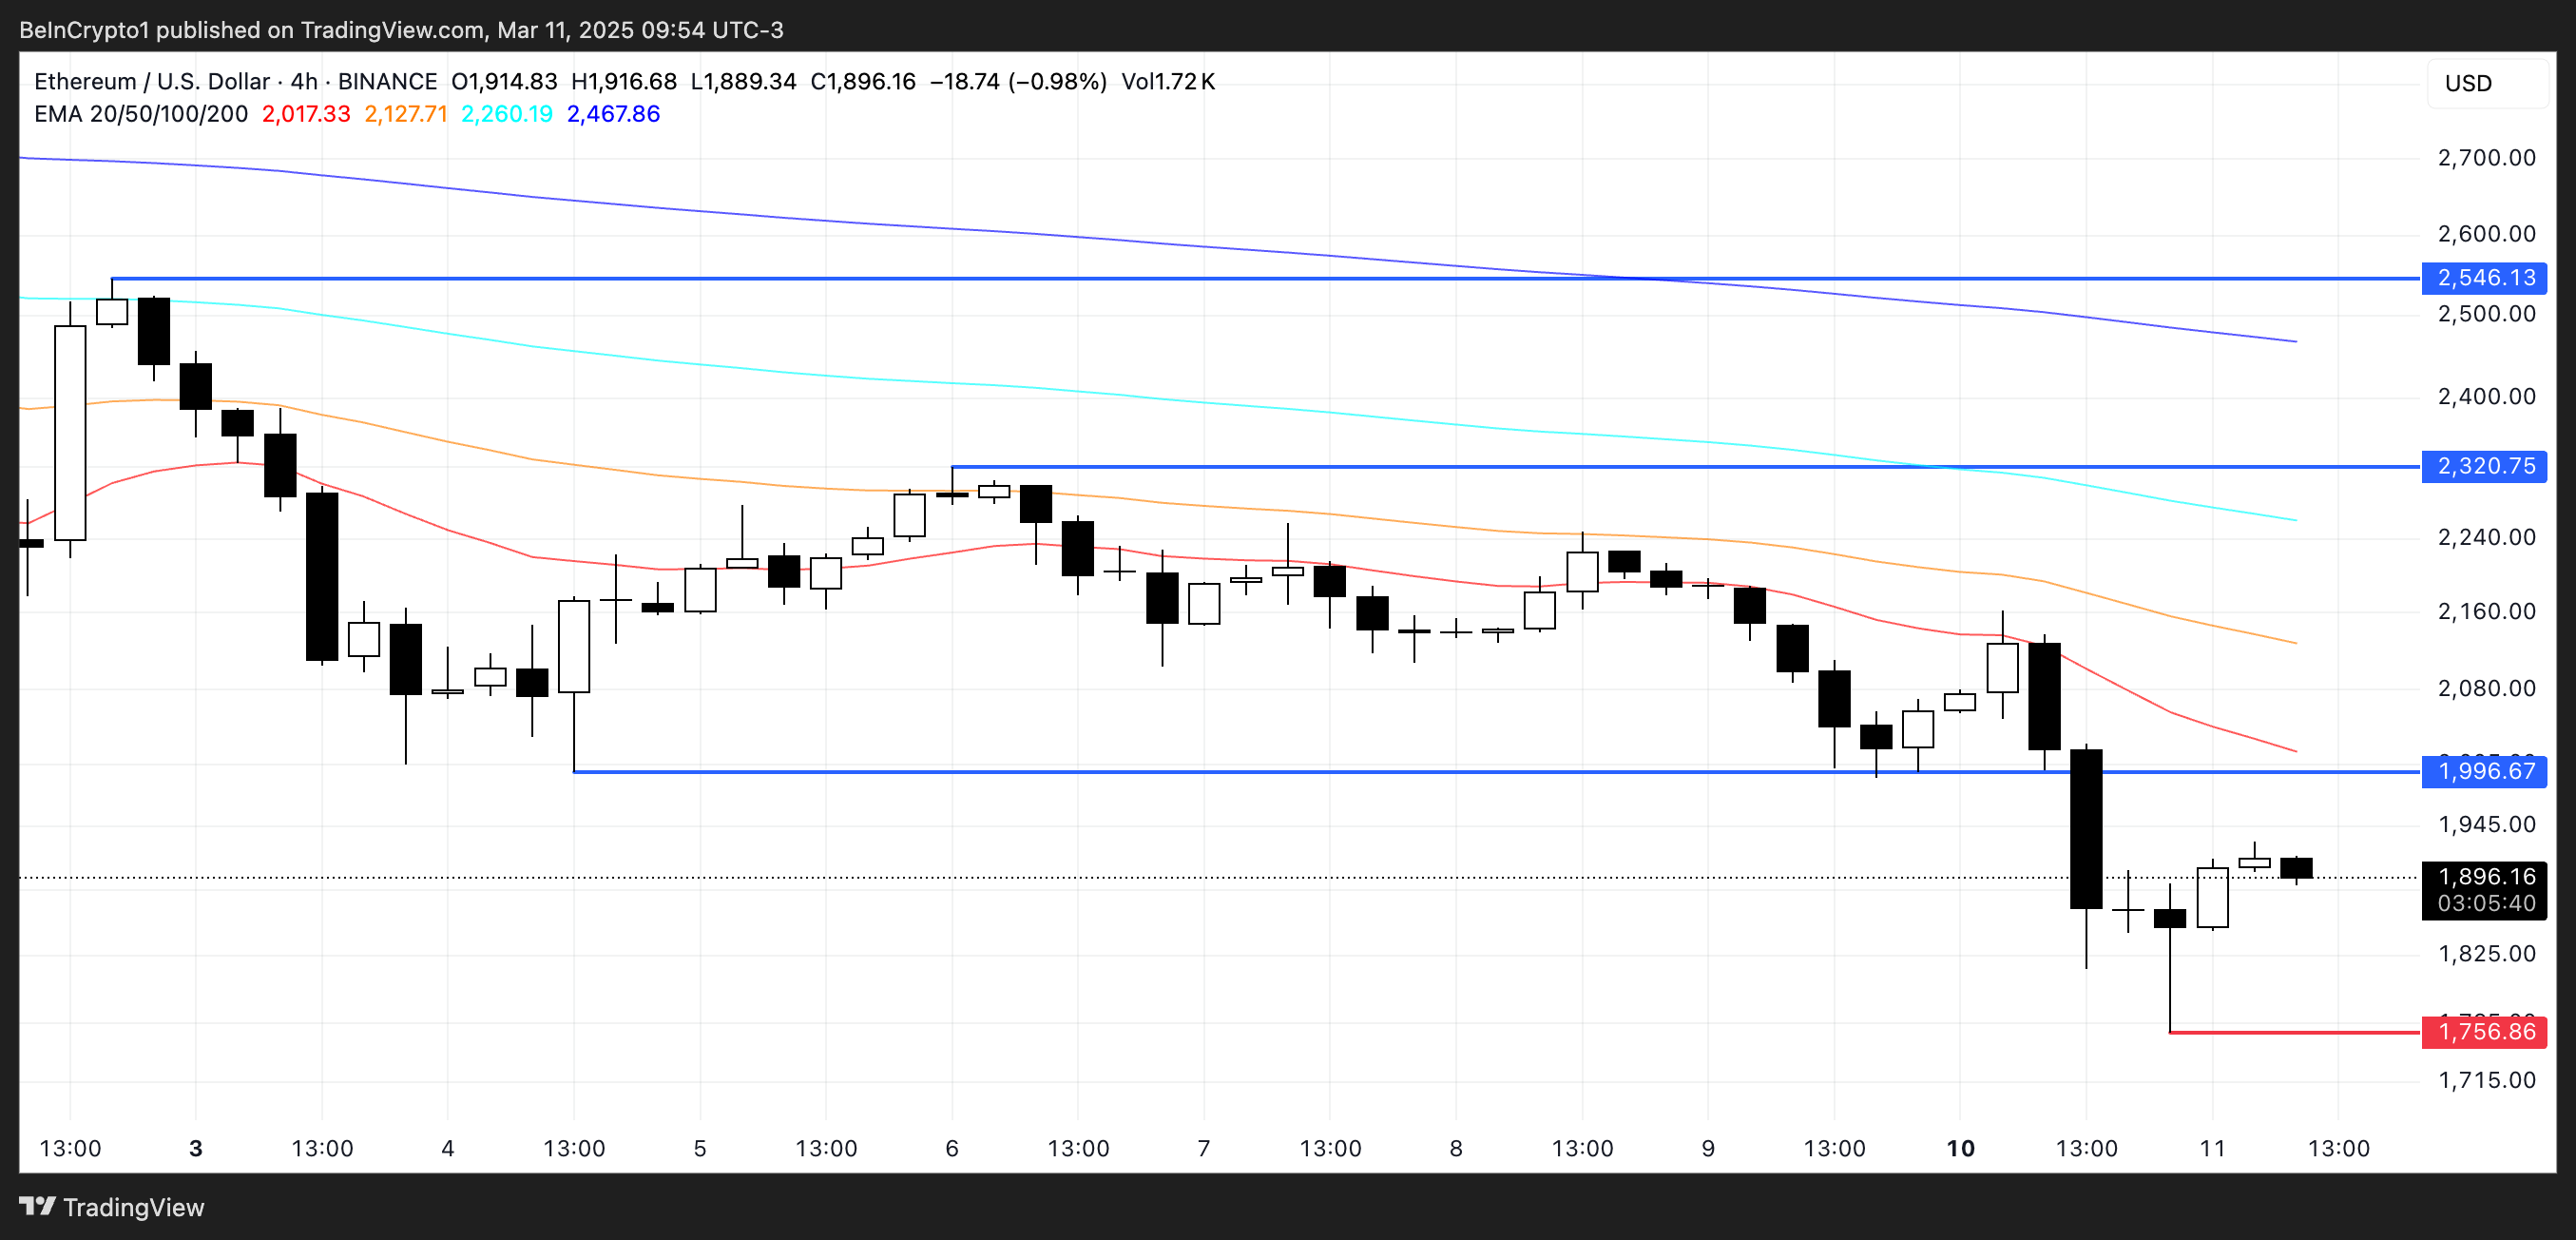
However, if ETH can reverse the downtrend, the first major resistance to overcome is $1,996. Successfully breaking above this level could trigger a strong recovery, pushing ETH towards the next resistance at $2,320.
If the bullish momentum accelerates, Ethereum could potentially reach $2,546, which would signal a complete reversal of the trend structure.
To achieve this, ETH would require sustained buying pressure and a crossover of the rising moving averages, which would be a signal to exit the current downward phase.


