

XRP has risen nearly 5% in the last 24 hours, breaking through $2.30. This shows that the bullish momentum is continuing to build. This recovery came as the market's expectations grew, with the SEC delaying decisions on several XRP ETF applications.
According to technical indicators, XRP's RSI has been steadily rising since March 10, approaching levels indicating strong buying pressure. XRP may soon challenge key resistance levels and could potentially break through $3 for the first time since the end of January.
XRP RSI has been steadily increasing since March 10
XRP's Relative Strength Index (RSI) has surged to 60.14, up from 27 three days ago. RSI is a momentum indicator that measures the speed and magnitude of recent price changes on a scale of 0 to 100.
Generally, an RSI above 70 indicates overbought conditions, suggesting potential correction. Conversely, an RSI below 30 indicates oversold conditions, often followed by price recovery.
The sharp increase from oversold levels suggests a strong momentum shift, with buyers stepping in to push the price higher.
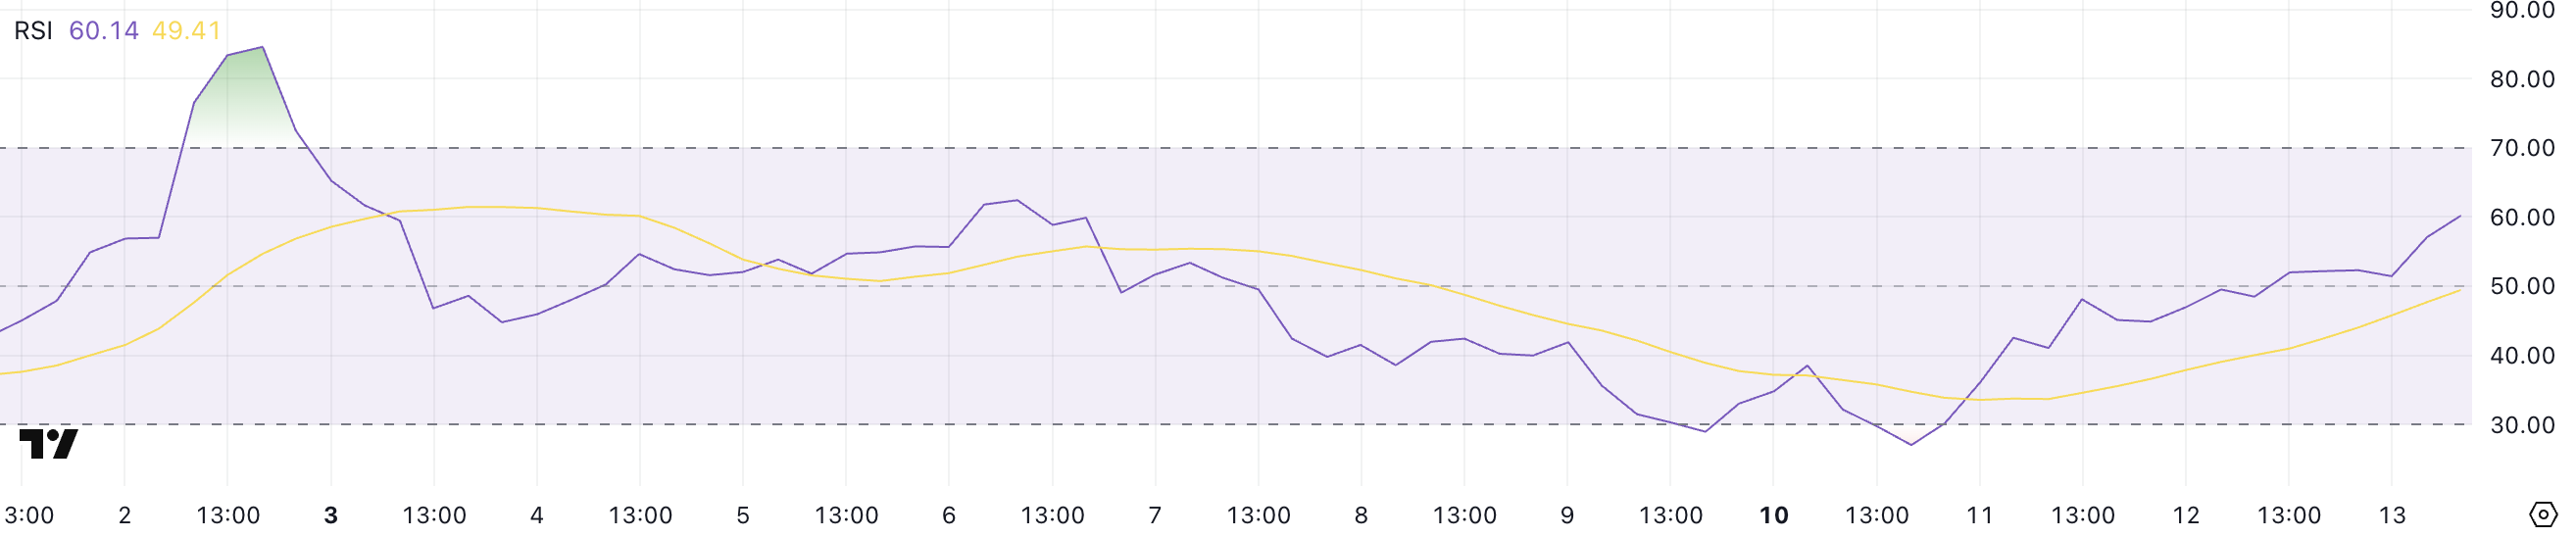
While the altcoin's RSI has reached 60.14, putting it in the bullish zone, it remains below the critical 70 threshold. Notably, XRP has not exceeded 70 since March 2, indicating this level has historically acted as resistance to momentum.
If the RSI continues to rise and breaks above 70, it would signal extreme bullishness and could lead to further price appreciation.
However, if it stabilizes or starts to decline at this level, XRP may undergo a correction or experience a temporary slowdown before making another move.
Ichimoku Cloud, Momentum Shift
XRP's Ichimoku Cloud chart shows the price action has recently broken above the blue conversion line, suggesting short-term bullish momentum.
Additionally, the price is currently trading above the red baseline, further strengthening the bullish reversal. However, the leading edge (Kumo) remains red, indicating the long-term trend is still bearish.
For XRP to maintain its upward momentum, it needs to break above the red Kumo's lower boundary and establish support above it.
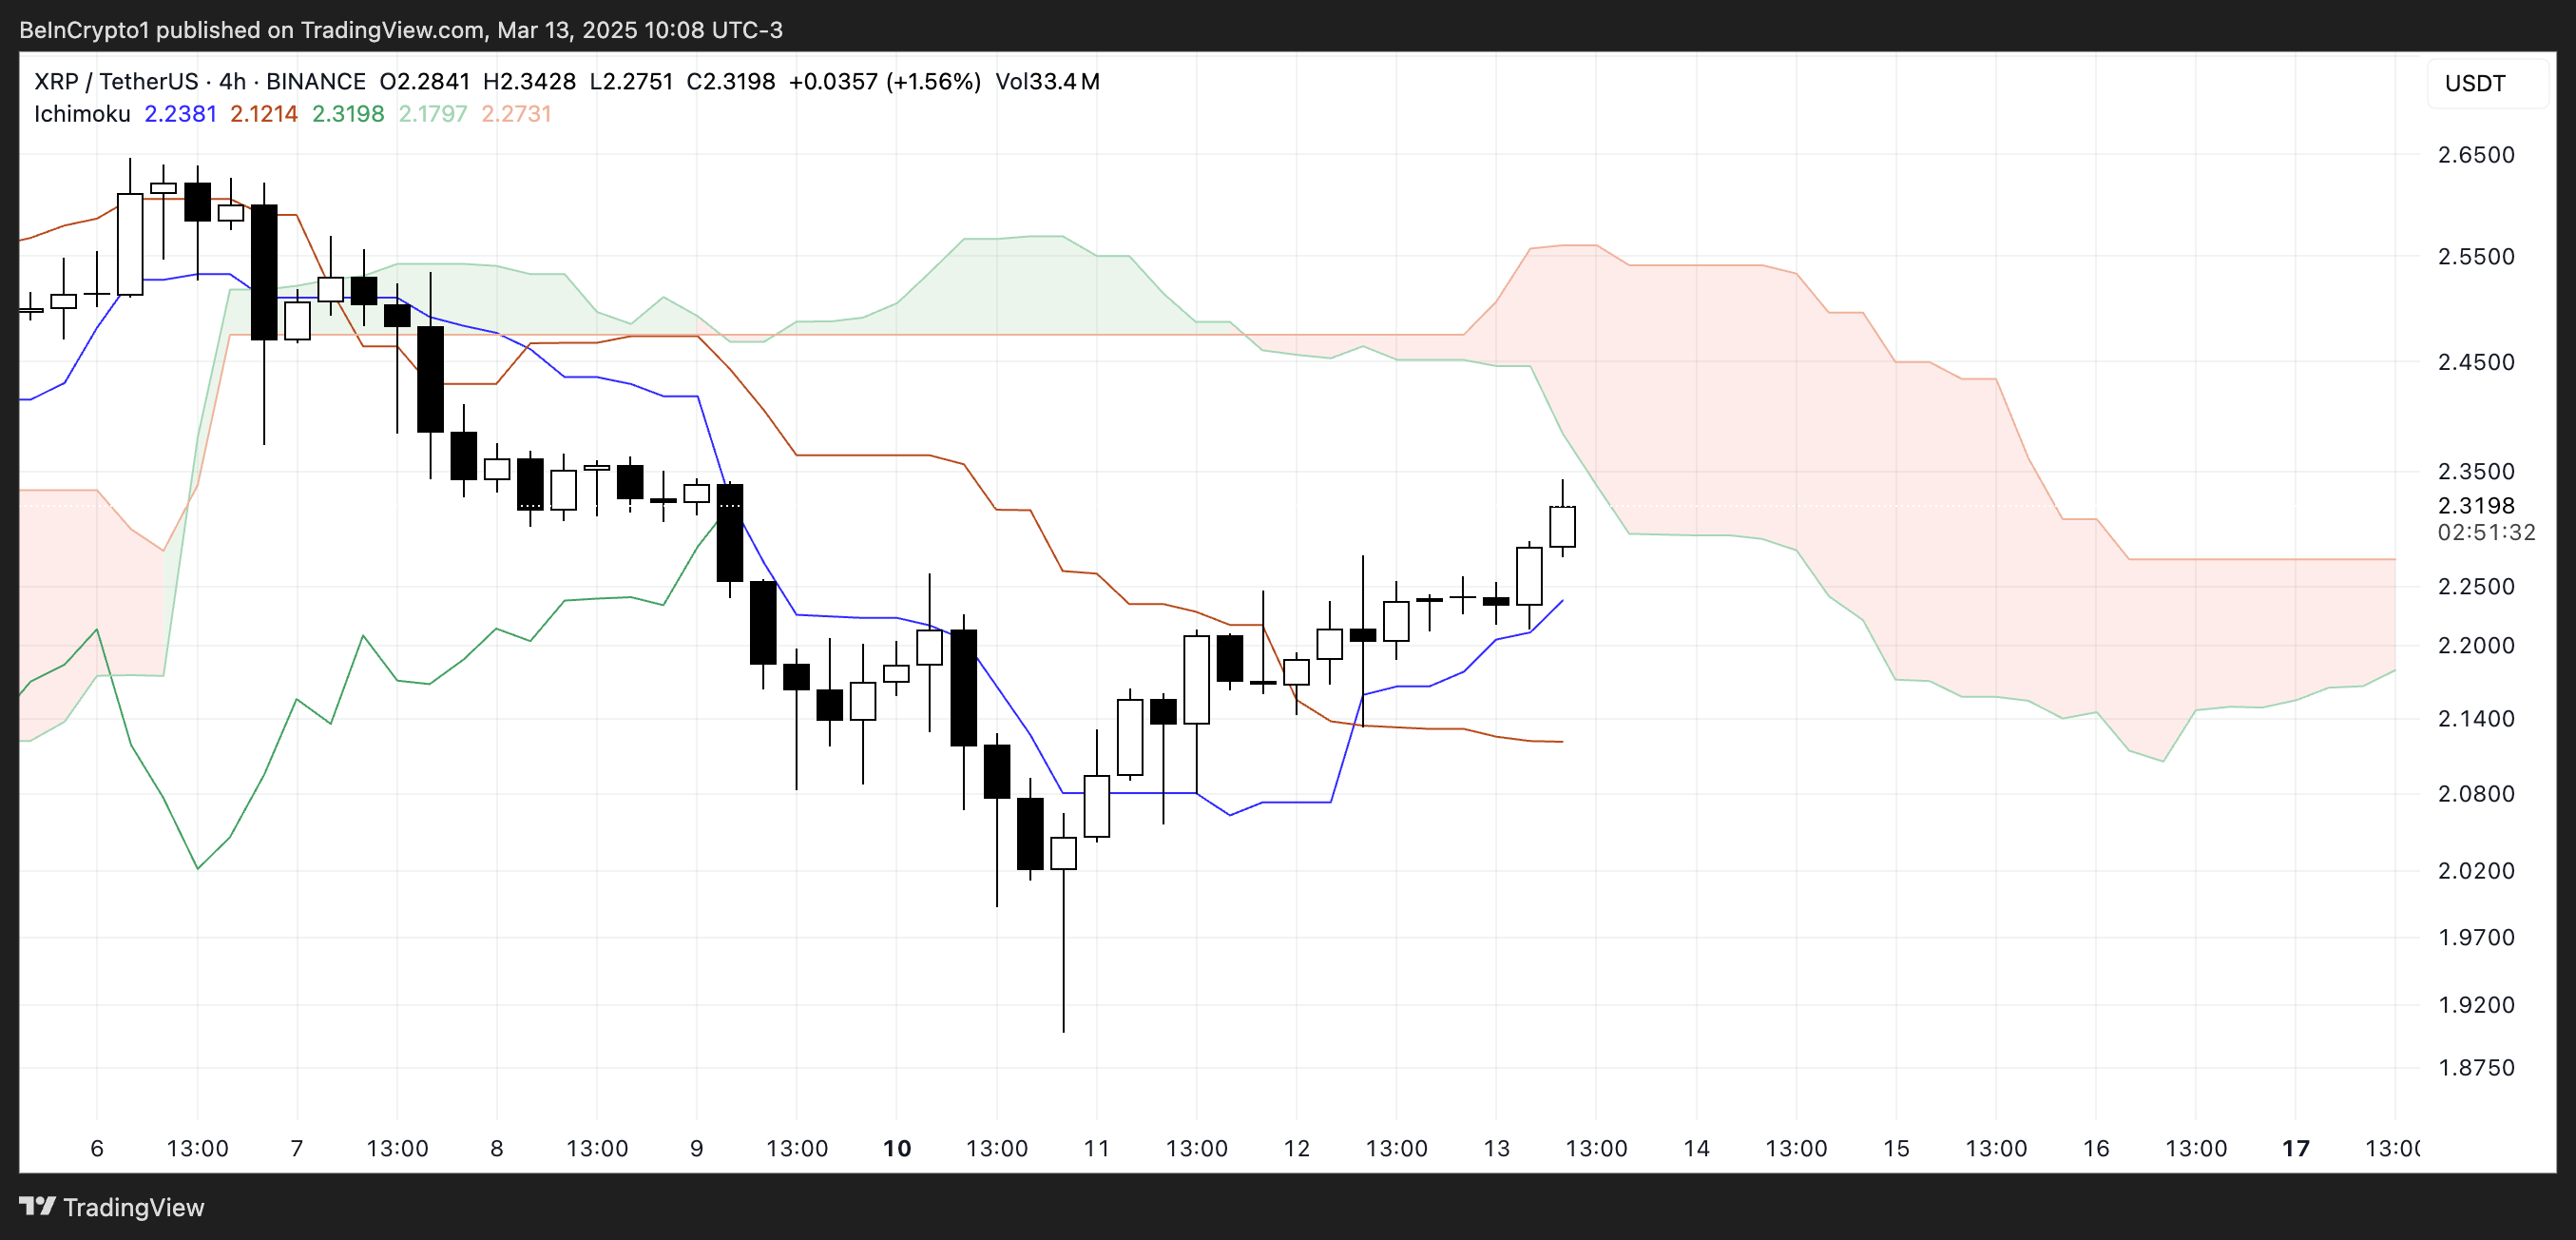
Facing resistance at the Kumo could make it difficult to sustain the current uptrend, and there is a risk of retreating towards the baseline for support.
Rejection from the Kumo could signal that the previous bearish trend may continue, especially if XRP falls below the conversion line.
However, if buyers manage to push XRP above the red Kumo, it would confirm a more significant trend reversal and could lead to a strong bullish momentum.
The upcoming candle close will be crucial in determining whether XRP can maintain its recovery or face new selling pressure.
Will XRP Break $3?
XRP's moving averages are still in a bearish formation, with the short-term moving average below the long-term moving average.
However, the recent upward movement of the short-term moving average suggests that bullish momentum is increasing. If they cross above the long-term moving average, it would often form a golden cross, associated with a trend reversal.
If this bullish cross occurs, XRP could gain enough strength to test the key resistance levels of $2.64 and $2.74. Additional news regarding the SEC and XRP ETF could drive this bullish trend.

Breaking above these levels would strengthen the bullish outlook, potentially allowing XRP's price to rise above $2.99 and $3, which would be the first time since the end of January.
On the downside, if the short-term recovery loses steam and the bearish structure remains intact, XRP may struggle to maintain the current price levels.
If the downtrend resumes, the $2.21 support level will come into play. This level was a significant area in previous price movements. If this support is not maintained, XRP could drop to $2.06 and potentially test $1.90 in a deeper correction.


