Redstone (RED) has risen 25% over the past 7 days, but has had a volatile week, falling 20% over the past 3 days.
This mixed performance reflects the current uncertainty surrounding RED's price movements. Technical indicators suggest the market is caught between establishing a bottom and lingering bearish sentiment. Momentum indicators like RSI and ADX imply the trend strength is weakening and decisions are becoming more difficult, but the price action remains above key support levels.
RED RSI in neutral territory for the past two days
Redstone's RSI (Relative Strength Index) has declined from 53.93 a day ago to 46.44, suggesting increasing bearish pressure and losing momentum from the uptrend.
Over the past two days, the RSI has hovered around the 50 level, generally indicating a market in indecision, with neither buyers nor sellers clearly in control.
However, the move below 50 today suggests the bearish momentum is starting to tilt the scales.
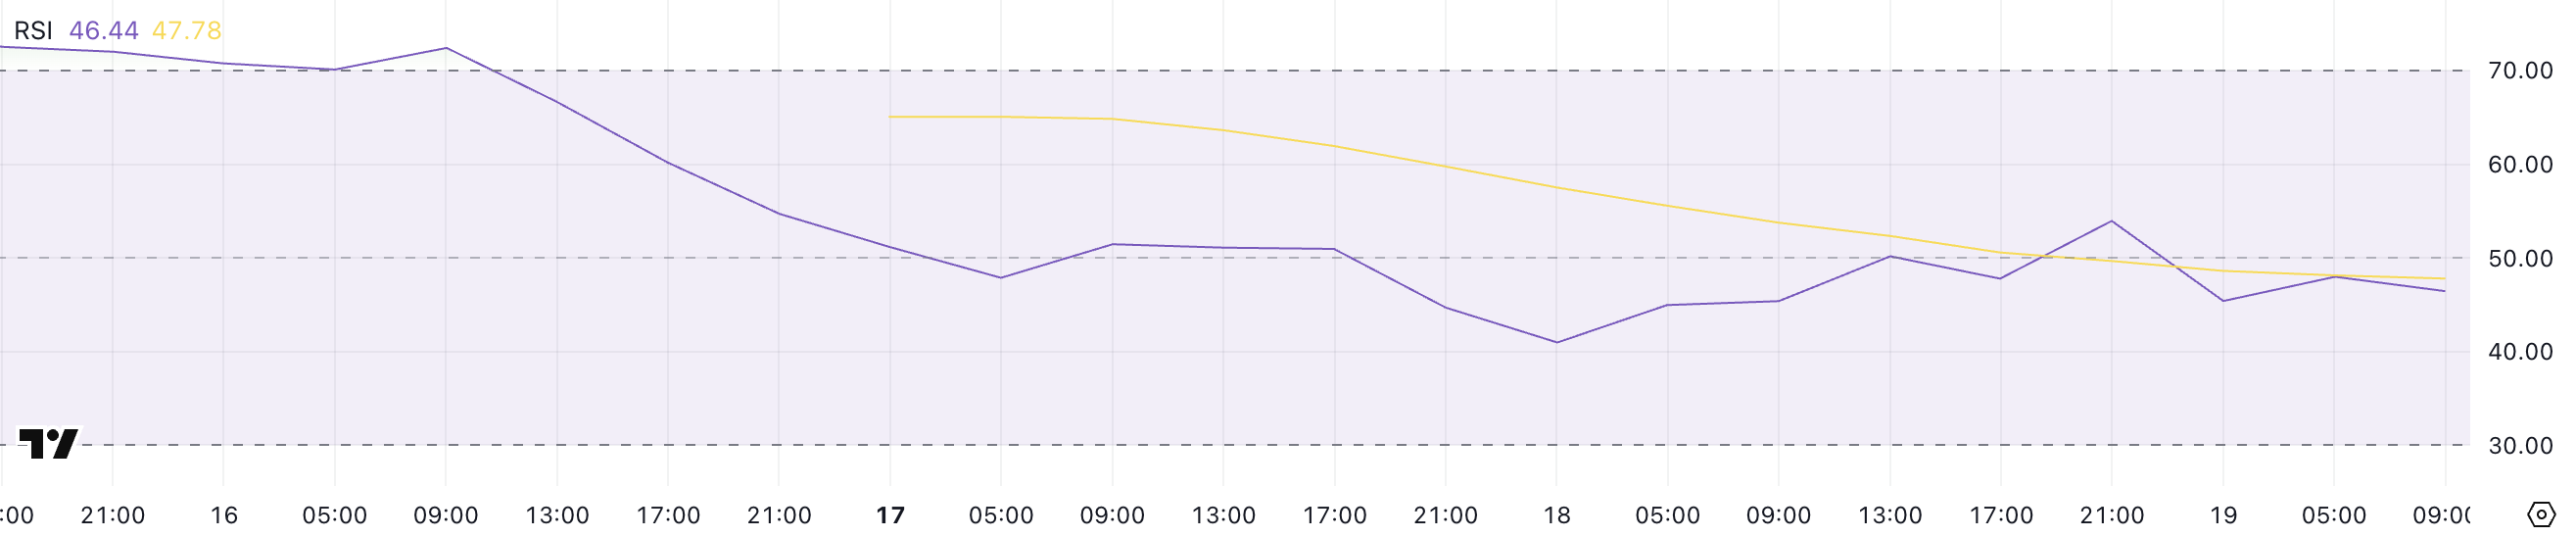
RSI is a momentum oscillator that measures the speed and change of price movements. It generally ranges from 0 to 100, with readings above 70 indicating overbought and below 30 indicating oversold conditions.
The 50 mark acts as a midline that traders watch for momentum shifts - above 50 indicates bullish bias, below 50 indicates bearish bias.
Redstone's RSI now sits at 46.44, which could signal the market is tilting more favorably towards sellers. Redstone is positioning itself as one of the most relevant leaders in the oracle space.
This change could indicate further downside potential unless buyers regain control and push the RSI back above 50 to re-establish upward momentum.
Redstone ADX, trend strength fading
Redstone's ADX (Average Directional Index) has dropped significantly to 24.9 from 42.6 two days ago, suggesting the current trend strength has notably weakened.
Previously, when the ADX was at 42.6, the market was experiencing a strong directional move, but the decline to the current level indicates the momentum behind that trend is fading.
However, Redstone remains positioned within a broader downtrend, suggesting the bearish conditions have not yet reversed but are losing steam.
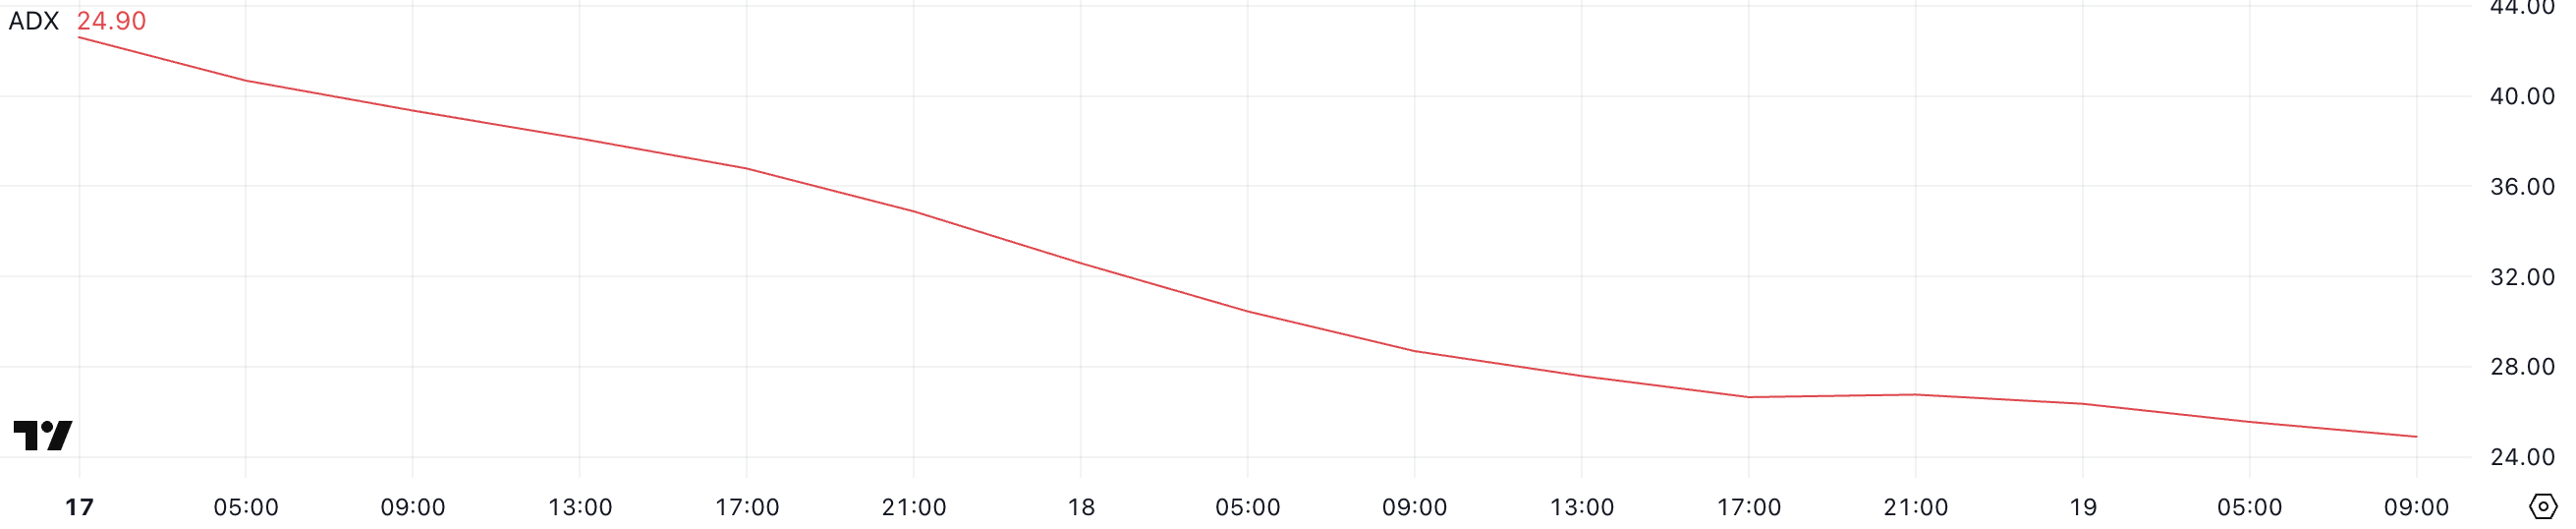
ADX is a technical indicator used to quantify the strength of a trend, without indicating the direction. Generally, ADX values above 25 suggest a strong trend, while values below 20 indicate a weak or non-trending market.
Values between 20 and 25 are often considered a "gray zone" where the trend may be losing conviction. With Redstone's ADX now at 24.9, the downtrend remains in place, but the recent strong momentum is lacking.
This weakened trend could lead to potential price stabilization or a short-term rebound, but caution is warranted as long as the downtrend structure remains intact.
Will Redstone cross $1 in the coming days?
Redstone's EMA (Exponential Moving Average) lines suggest the asset is entering an adjustment phase. The price action is moving sideways without strongly trending in either direction.
A key support level has been identified at $0.65, which is currently acting as a floor for the price movement. If this support is tested and broken, Redstone could potentially see further downside, with a target around $0.50.
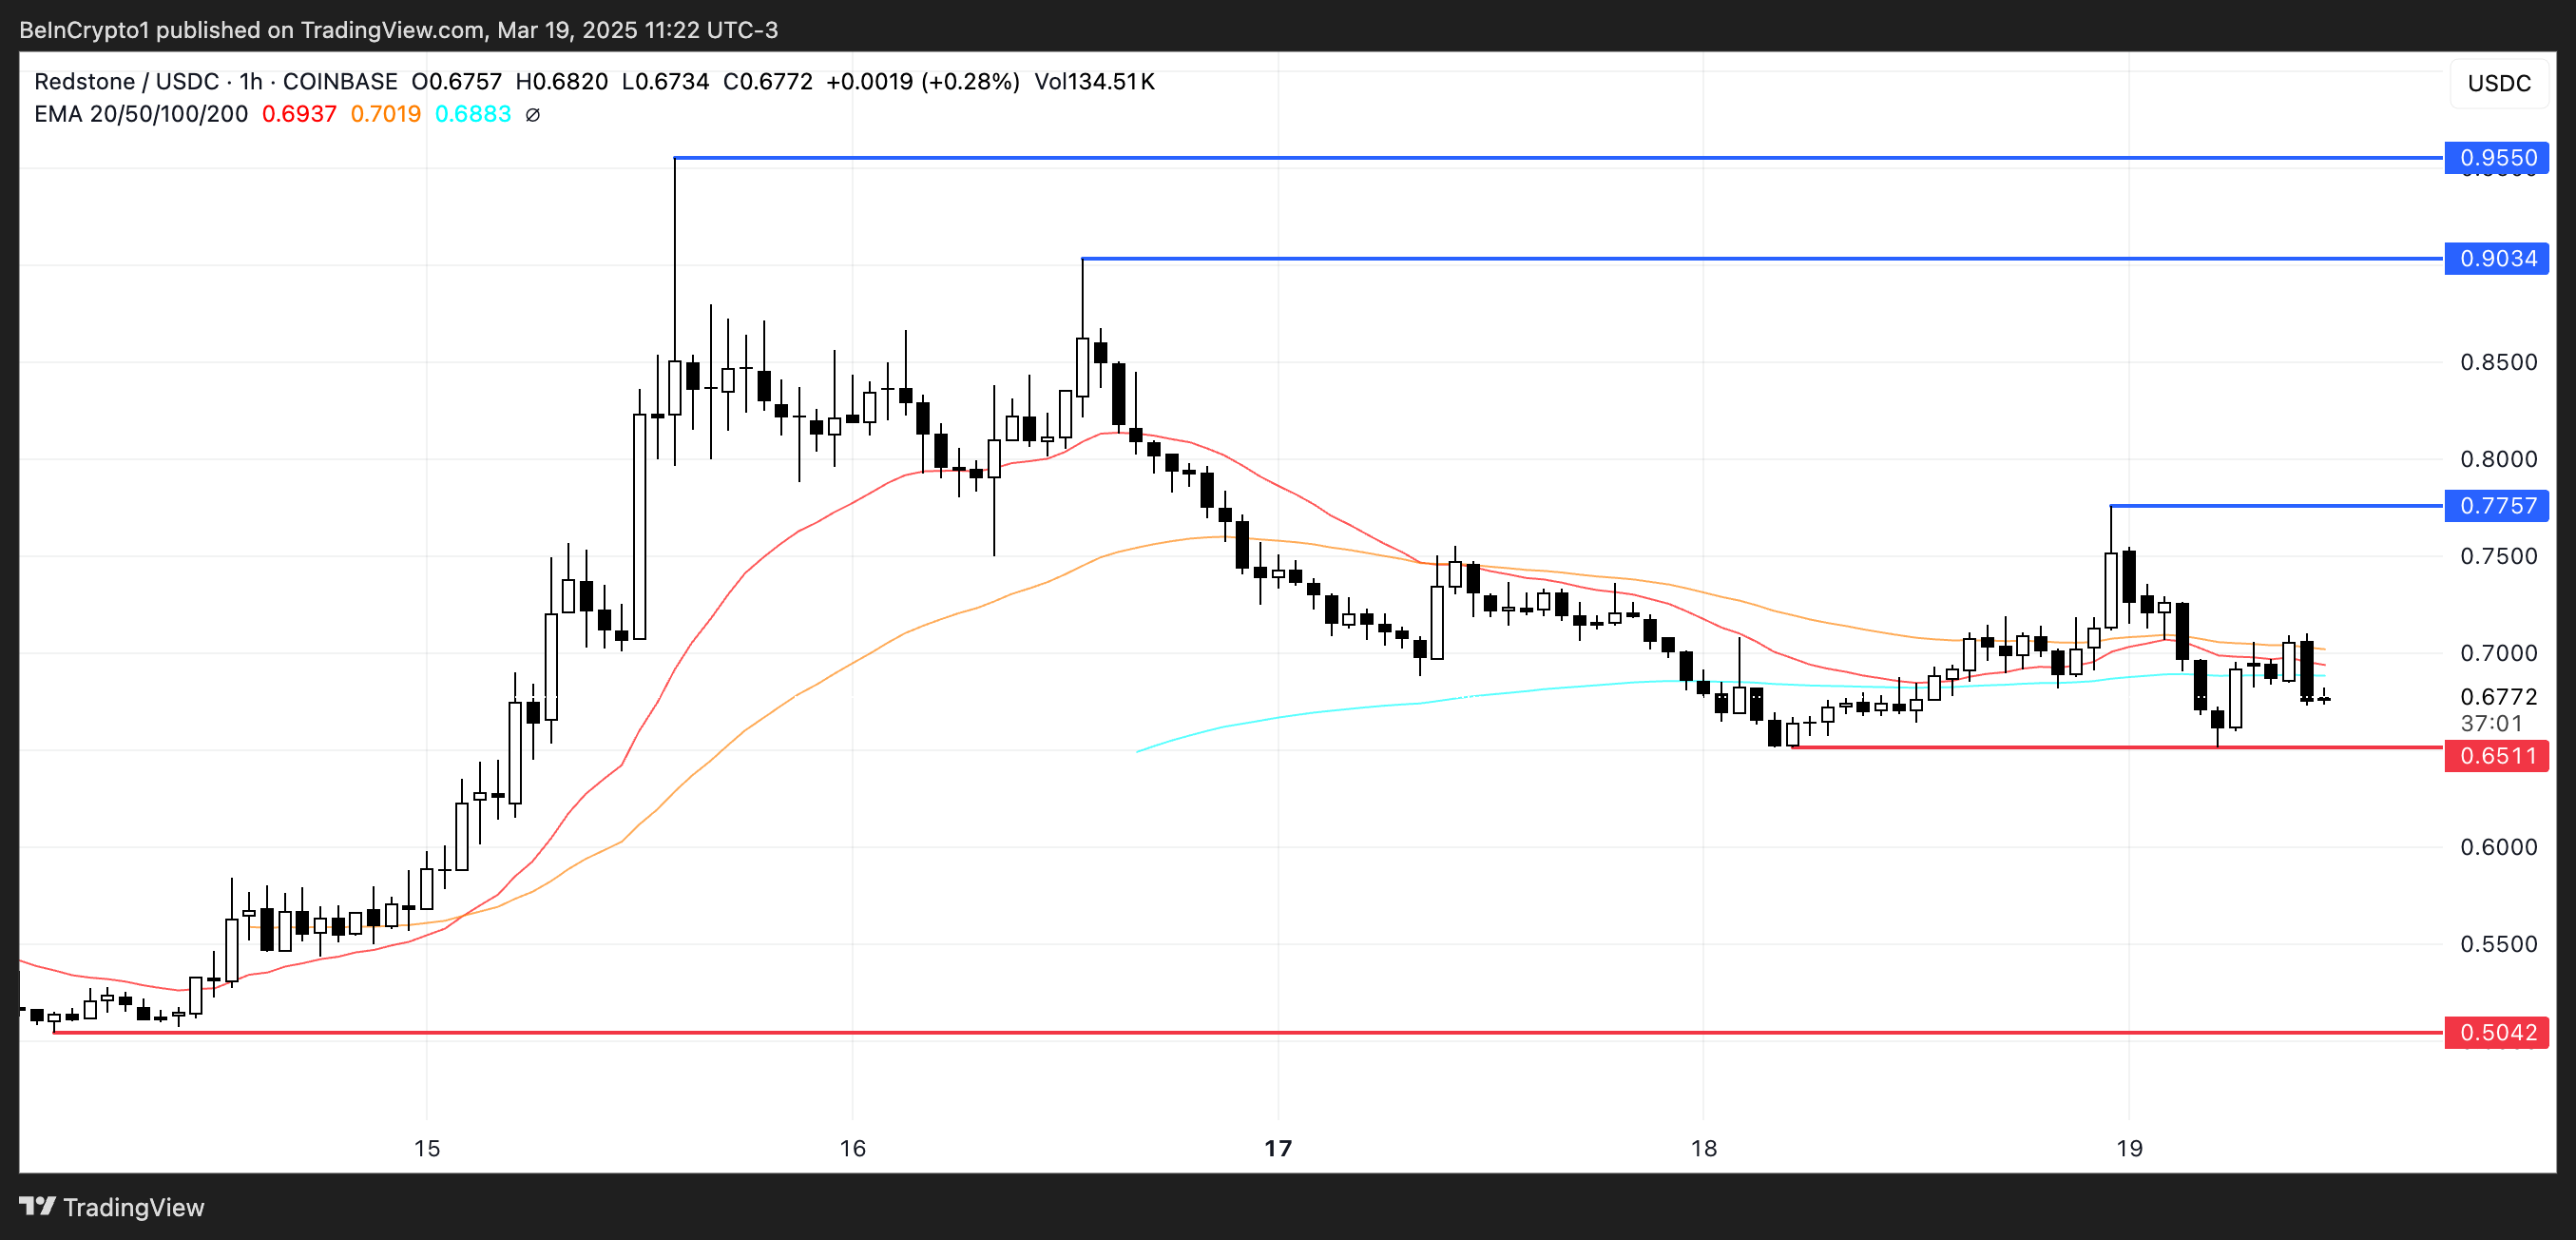
Conversely, if the price starts to build upward momentum, Redstone may attempt to break through resistance at $0.77. Successfully clearing this level could open the path to $0.90 and $0.95, potentially allowing Redstone to recover the $1 mark for the first time since March 3rd, making it one of the most trending altcoins in the market.
For Redstone, the sideways movement of the moving averages reflects the uncertainty among market participants. The $0.65 support level is currently crucial. Maintaining this could provide an opportunity for buyers to stage a rebound, while losing it could invite stronger selling pressure.