

Pi Network (PI) is under significant pressure, dropping over 9% in the past 24 hours and 29% over the past week. Its market capitalization has fallen to $5.5 billion, a sharp decline from its peak of $19 billion in late February.
Technical indicators show sellers are completely in control, with no signs of momentum recovery yet. As PI tests key support levels, the next few days will be crucial in determining whether it will stabilize or continue its downward trend.
Pi Network DMI, Sellers Completely Dominate
The Pi Network's DMI chart shows ADX rising from 25.1 to 34.99 the previous day, indicating a strong increase in trend strength. ADX, or Average Directional Index, measures trend strength but not direction.
Values above 25 suggest a strong trend is forming, and values over 30 confirm this. With ADX now approaching 35, Pi Network is definitely in the trend zone—but identifying the direction of that trend is important.
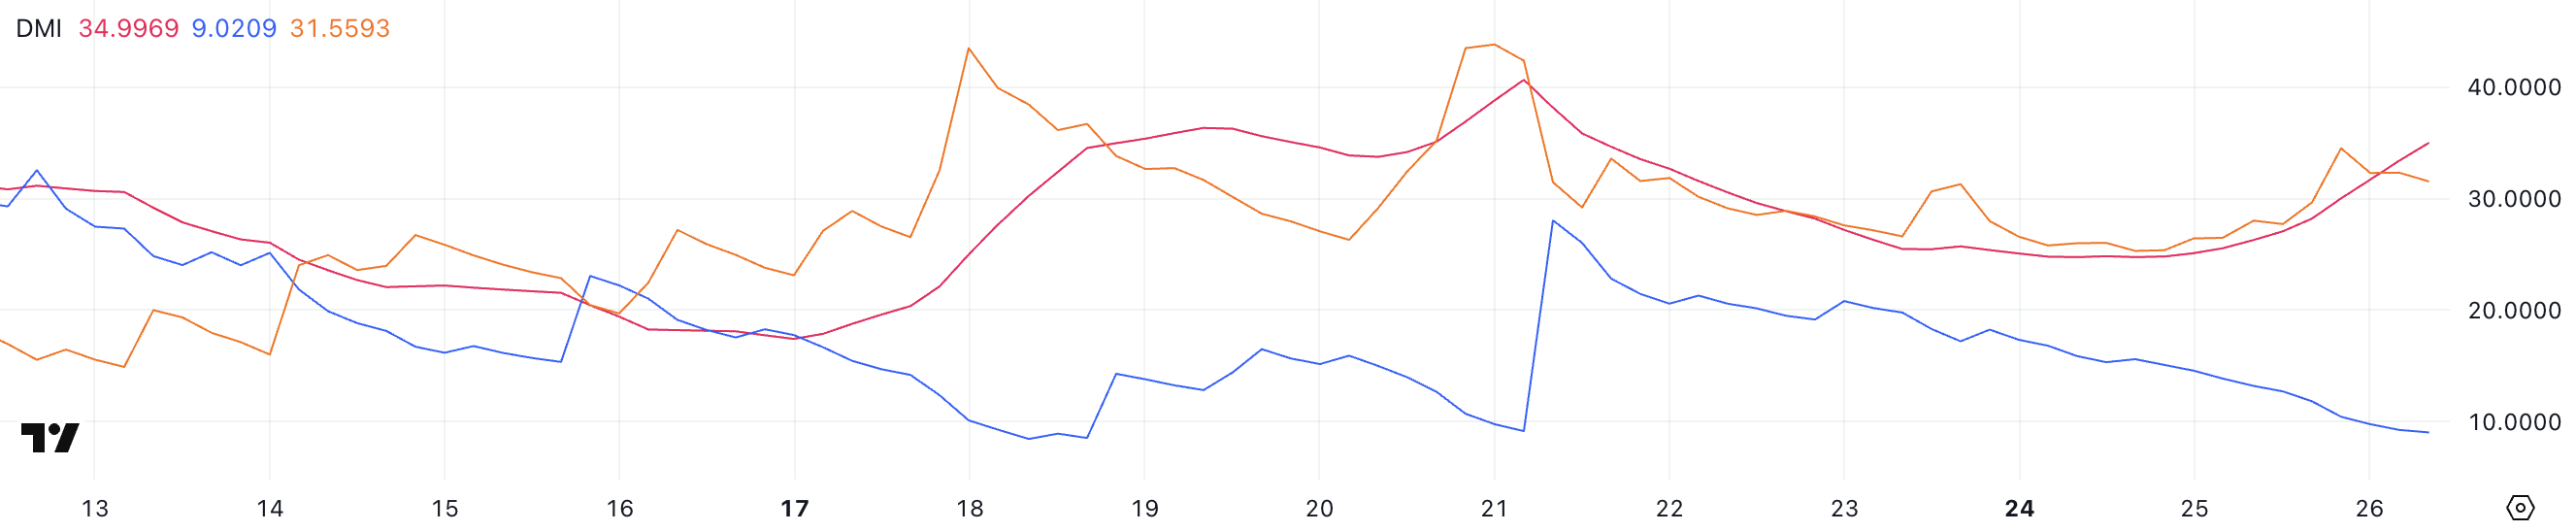
Currently, -DI (downward pressure indicator) has risen from 25.31 to 31.55, while +DI (upward pressure) has dropped from 15.59 to 9. The widening gap between these two indicators confirms the strengthening of the downward trend. Analysts have reviewed the recent reasons why PI has not been listed on Binance and Coinbase.
Despite the sharp rise in trend strength shown by ADX, the decline in +DI and rise in -DI indicate that sellers are still completely in control. If the trend does not reverse soon, Pi Network may continue to face additional downward pressure in the short term.
PI Lacks Strong Momentum
Pi Network's Chaikin Money Flow (CMF) is currently at -0.23, noticeably dropping from 0 two days ago. CMF is a volume-weighted indicator measuring buying and selling pressure over a certain period, typically measured over 20 or 21 days.
Values above 0 suggest accumulation (buying pressure), while values below 0 indicate distribution (selling pressure). The further from 0, the stronger the pressure in that direction.
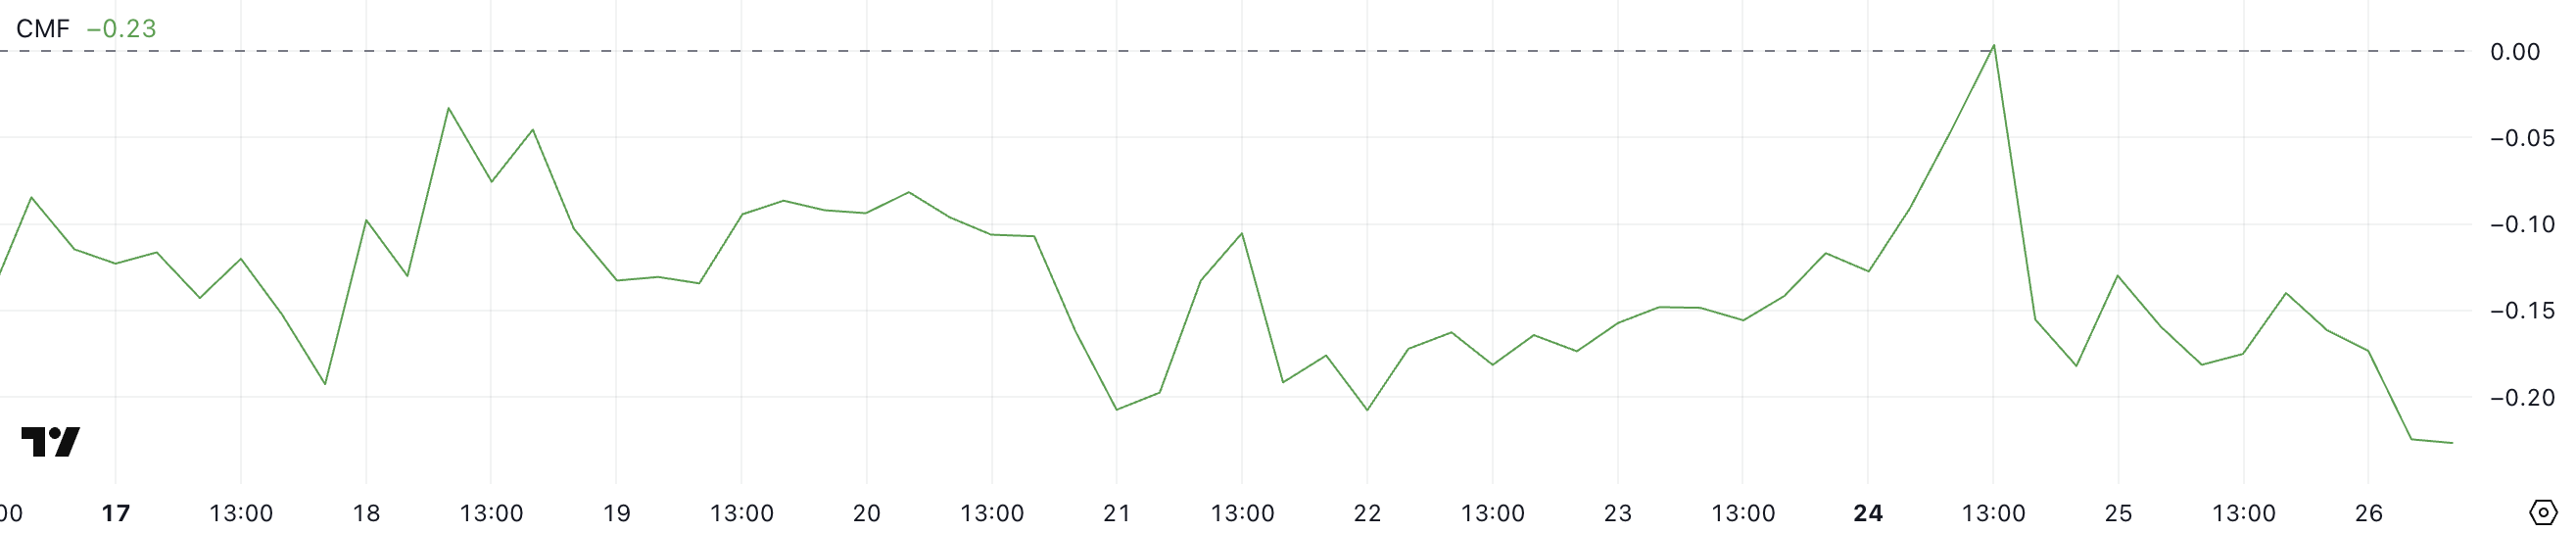
With a value of -0.23, Pi Network's CMF is at its lowest historical level, showing heavy continuous outflow. Notably, this indicator has not turned positive since March 15, emphasizing ongoing selling activity.
This deep negative value indicates a strong downward bias, suggesting capital is continuously leaving the market. If CMF does not recover, the continued distribution phase may continue to burden Pi Network's price.
Pi Network to Fall Below $0.70 Soon?
The Pi Network price chart shows a critical support level at $0.718 that has recently supported the price.
If this level breaks, it could trigger a larger decline to $0.62, the lowest price since February 21.
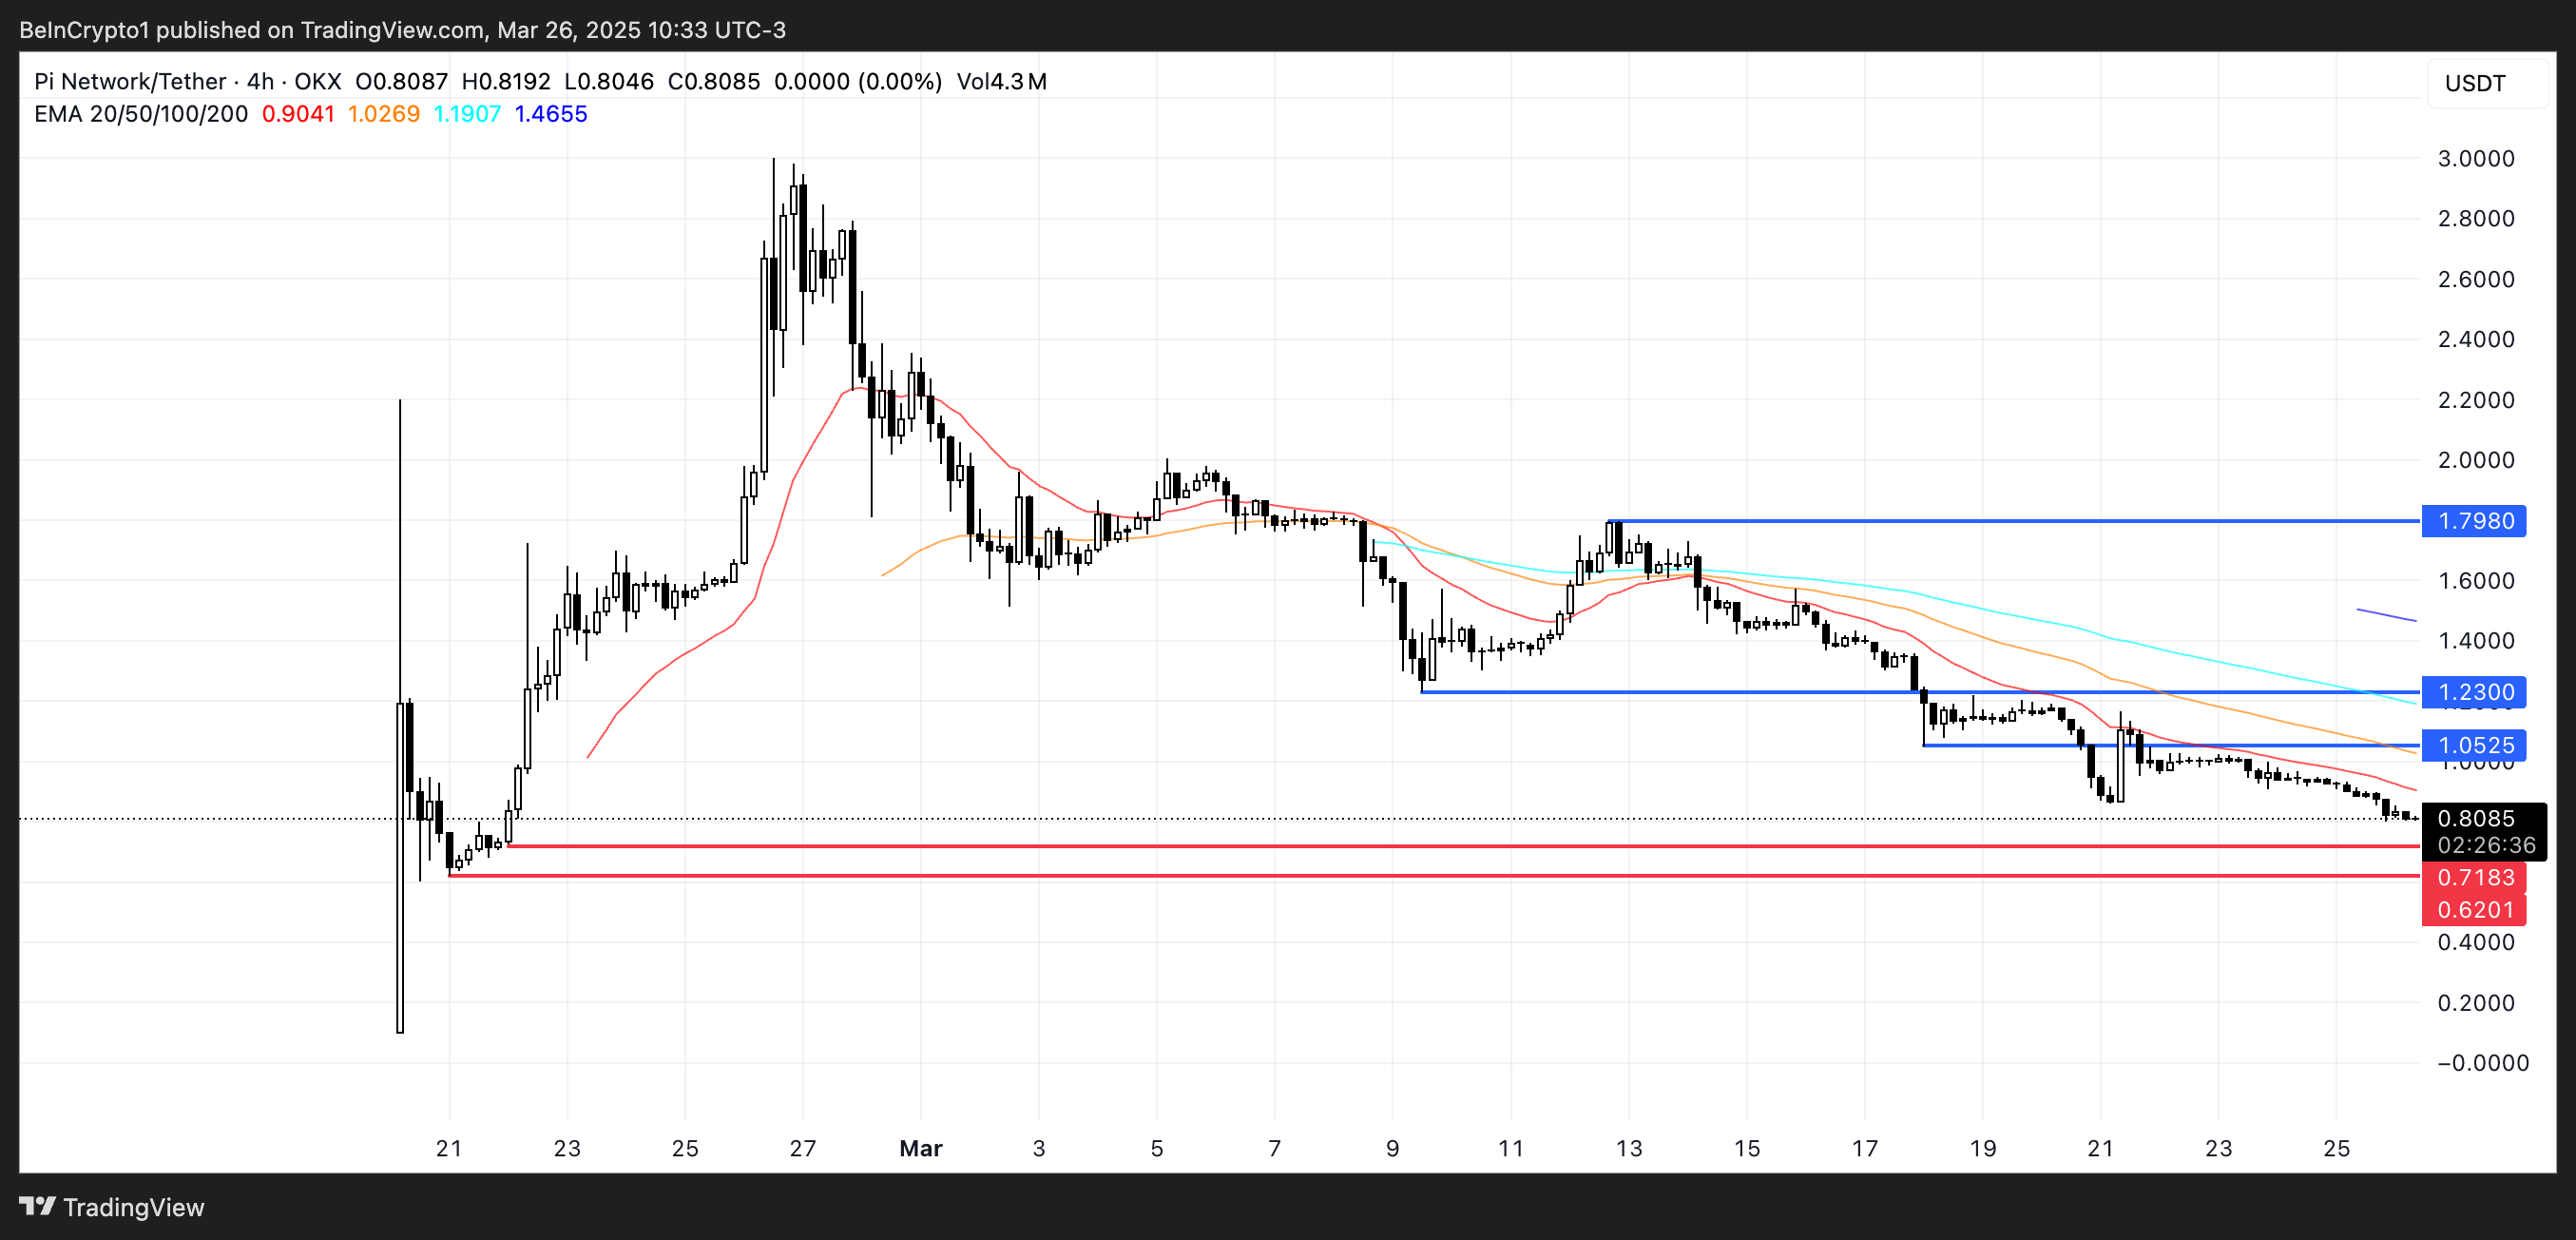
On the other hand, if Pi Network reverses its trend and recovers momentum, the first major resistance to watch is at $1.05. Breaking this level could open a path to $1.23, and if bullish sentiment returns, the price could rise to $1.79.
This represents a potential 54% increase from current levels, but requires a strong momentum shift and new market interest.


