

Bitcoin (BTC) enters an unstable footing in April. As the expected "Liberation Day" tariff announcement approaches on Wednesday, the downward momentum is disappearing and uncertainty is increasing. Technical indicators such as DMI, Ichimoku Cloud, and moving averages show mixed signals, with early signs of buyer strength emerging.
The market remains within a range, and both downward tests and breakout rallies are possible depending on macroeconomic developments. With the JOLTS report scheduled today and tariff clarity still uncertain, Bitcoin's next major movement could be imminent.
BTC DMI, Buyers Dominating… Will It Continue?
Bitcoin's Directional Movement Index (DMI) is showing potential signals of momentum reversal. The Average Directional Index (ADX), which measures trend strength, dropped from 40.38 to 28.59 yesterday. This indicates that the current downward trend is losing momentum.
Generally, an ADX above 25 indicates a strong trend, while below that suggests a weakening or consolidating market. 28.59 still shows a moderate trend strength, but the decline suggests a decrease in momentum.
Meanwhile, the +DI (positive directional indicator) surged from 9.35 to 23.75, and the -DI (negative directional indicator) dropped from 34.58 to 17.88. This suggests that bullish pressure is beginning to emerge.
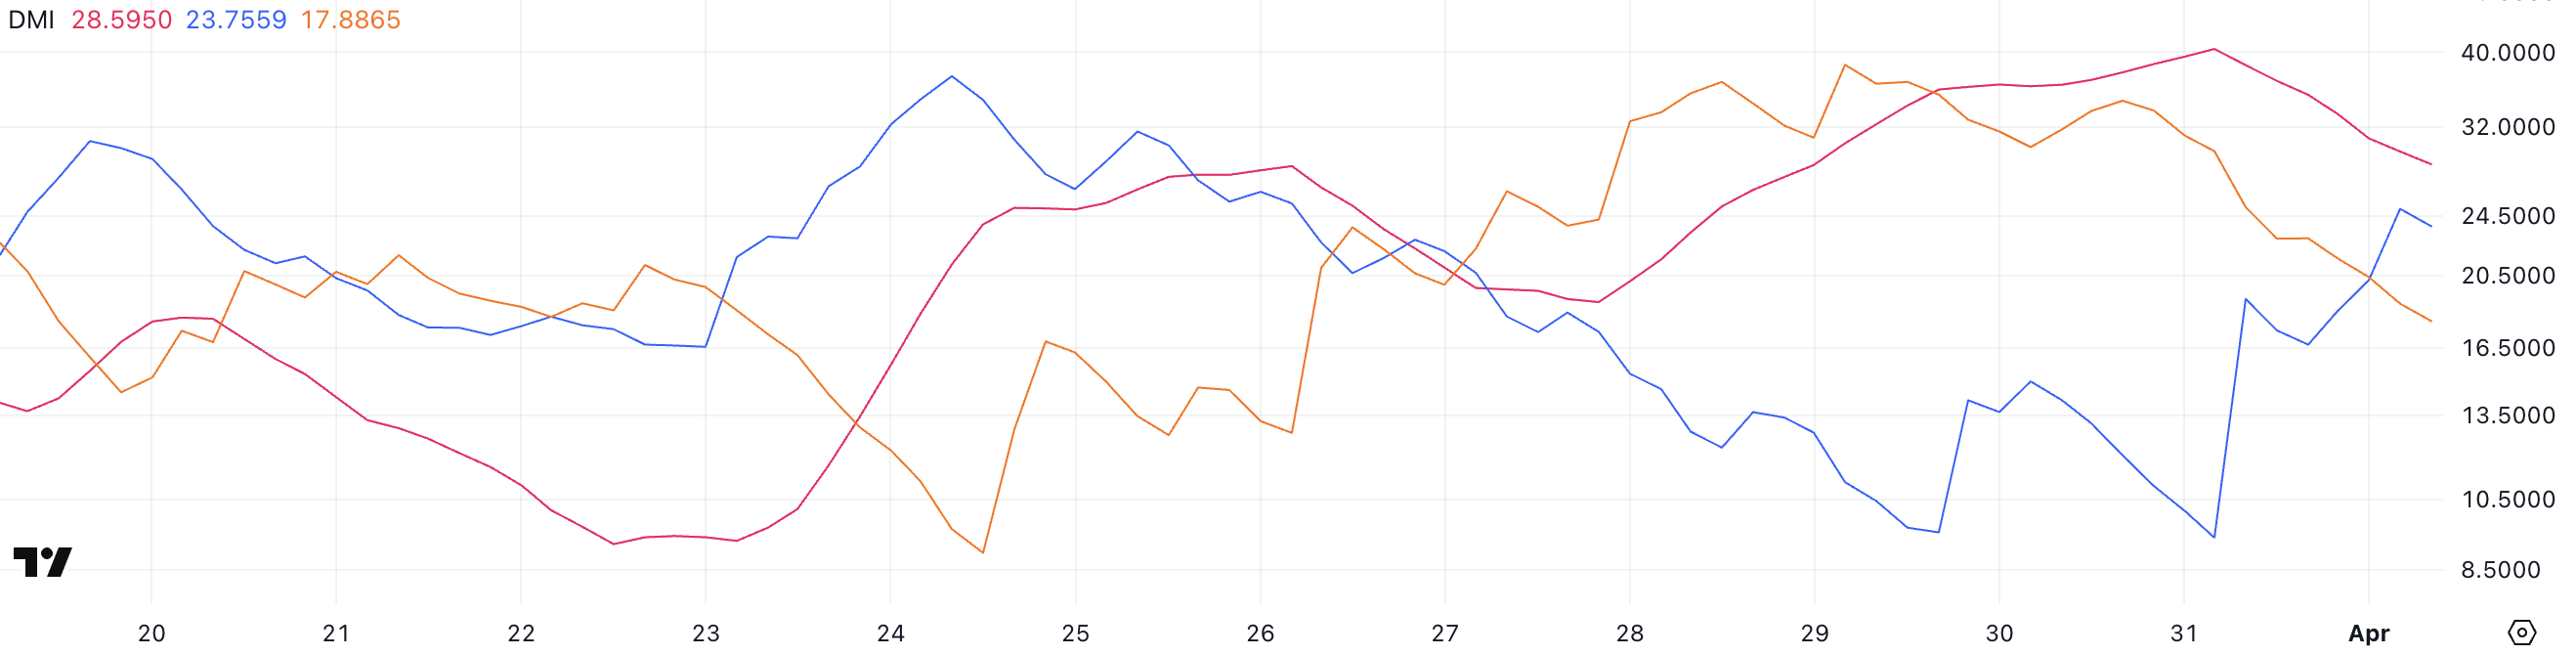
The crossover of +DI and -DI can indicate an early trend reversal, which can be confirmed by additional price movements and trading volume. However, Bitcoin is still within a broader downward trend.
Market participants are watching today's JOLTS report, a key indicator of job openings in the US. A stronger-than-expected report could boost the dollar and pressure the cryptocurrency market. Conversely, weak data could raise expectations of rate cuts, potentially lifting Bitcoin and other risk assets.
With directional indicators changing and macroeconomic data at play, Bitcoin's next movement could be significantly influenced by external factors. Recently, BlackRock CEO Larry Fink mentioned that Bitcoin could replace the dollar's role as the world's reserve currency.
Bitcoin Ichimoku Cloud, Downtrend Still Persists
Bitcoin's Ichimoku Cloud chart shows ongoing bearish pressure despite recent short-term recovery signs. The current price is testing the key resistance level of the baseline (red line).
The conversion line (blue line) flattening and curving upward could be a signal of momentum reversal, but the price remaining below the cloud indicates that the broader trend is still bearish.
The forward cloud is declining in red, suggesting continued downward pressure in the short term.
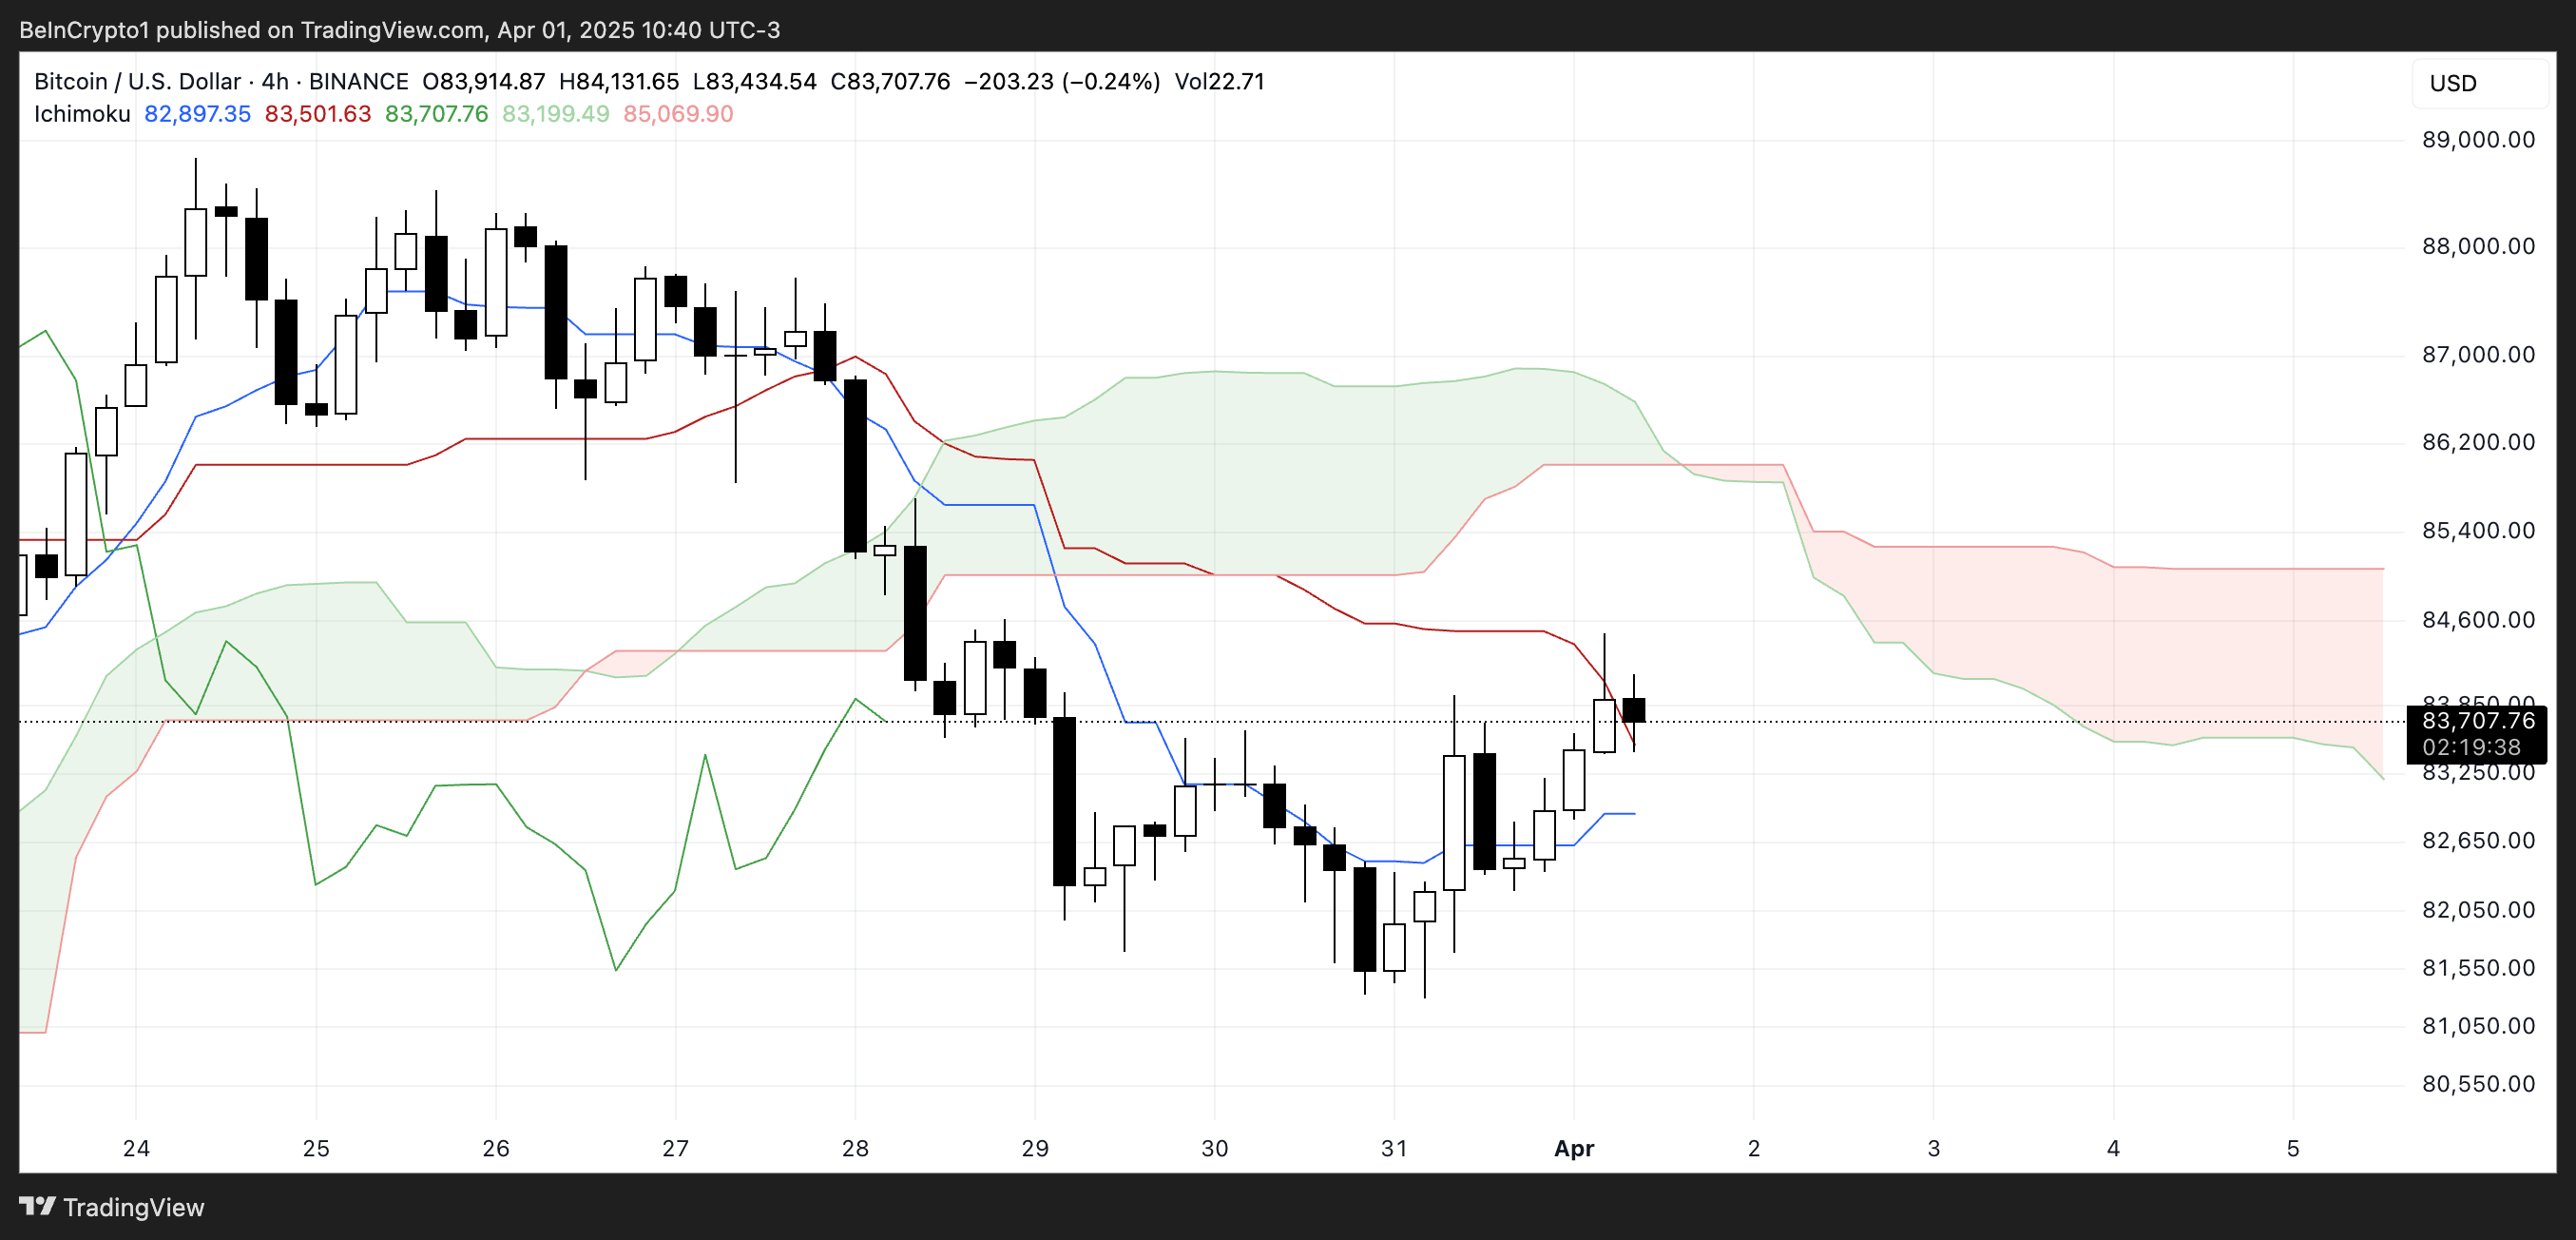
However, the price momentarily pushing into the lower boundary of the cloud suggests a potential challenge to the bearish structure.
For a stronger trend reversal signal, Bitcoin needs to break above the cloud and form a bullish cloud conversion. Until then, the Ichimoku setup suggests a cautious recovery.
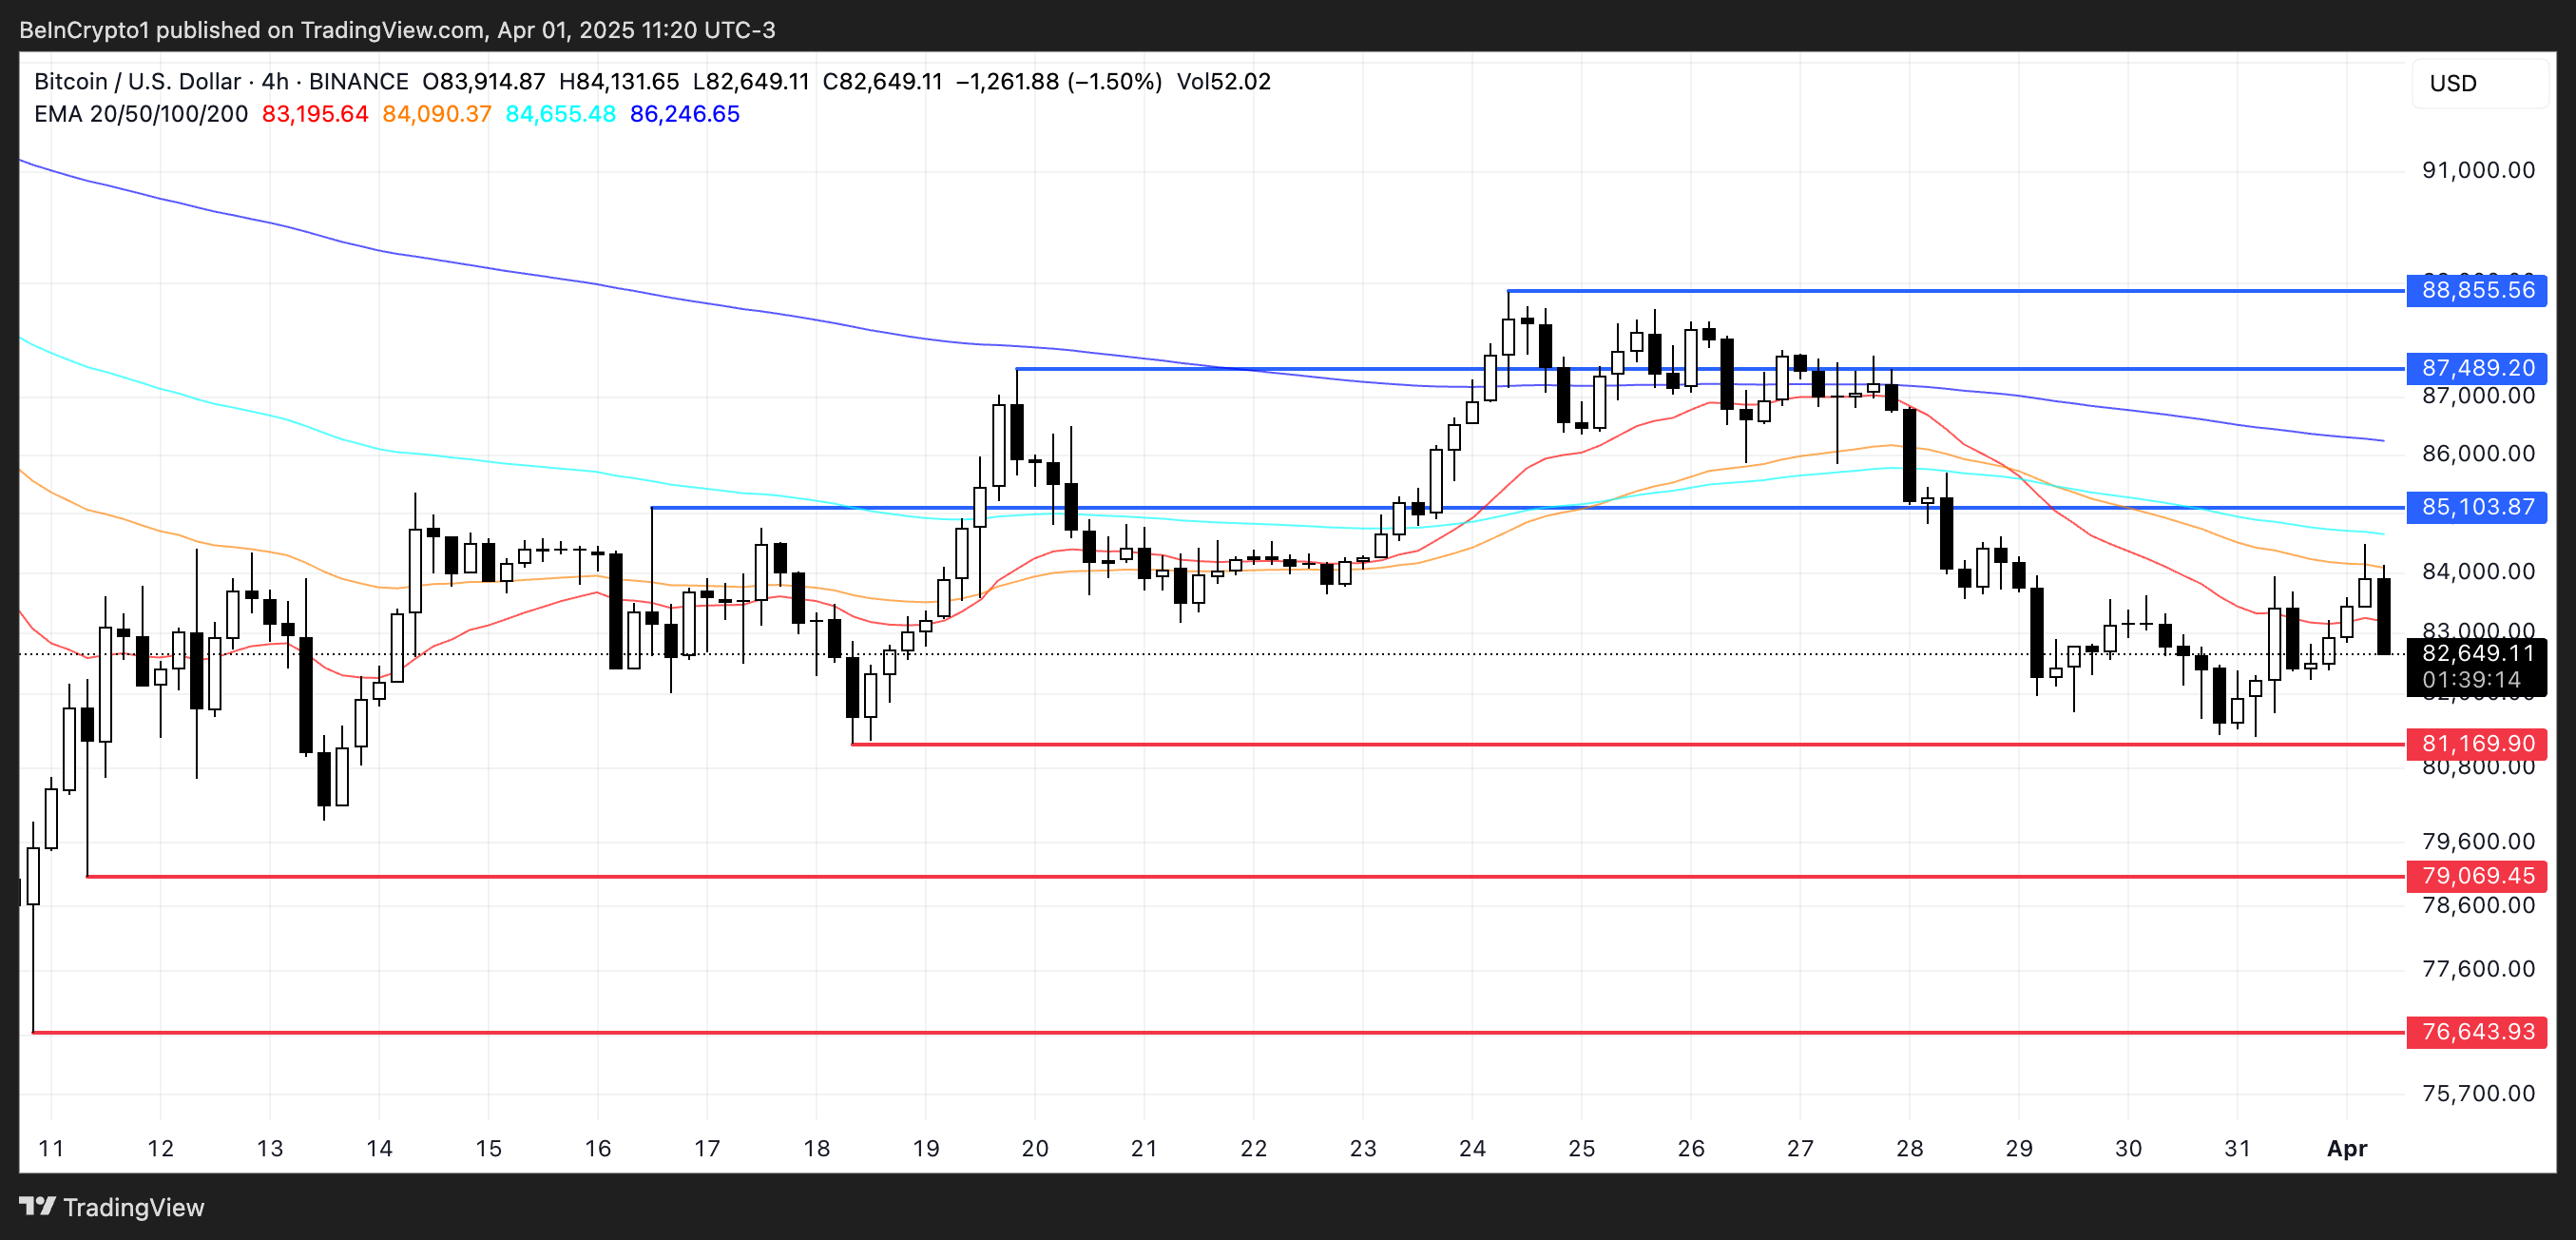
Liberation Day, Big Impact on Bitcoin Price?
Bitcoin's moving averages remain bearish. The short-term average being below the long-term average indicates continued downward momentum.
This setup suggests sellers are still controlling the trend, and unless reversed, the Bitcoin price could revisit key support zones. If the current downtrend accelerates, it might first test support around $81,169. If that level doesn't hold, a deeper decline to $79,069 or even $76,643 could follow.
Cryptocurrency analyst and Coin Bureau founder Nick Puurin told BeInCrypto that market uncertainty is rising ahead of the so-called "Liberation Day" tariff. He mentioned that Bitcoin could make a sharp move in either direction, potentially dropping to $73,000 or surging to $88,000:
"As Liberation Day approaches, uncertainty about the tariff scale is destabilizing Bitcoin and other risk assets. (…) This range-bound pattern will continue until more clarity is added about the tariff. However, if there are surprisingly soft news or some form of concession, there could be a breakout from the current trading pattern. If so, the level to watch in the short term is $88,000, which would require a significant volume increase to indicate an extended rally."
He argues that the tariff shock could cause BTC to test the $73,000 level:
"If a tariff shock occurs, conversely, BTC could drop to $79,000 in the short term, or if market fear spreads extremely, it could fall further to the next support level at $73,000." – Nick told BeInCrypto.
However, if Bitcoin reverses the trend and gains upward momentum, the first target would be climbing to the $85,103 resistance. Breaking that could lead to higher levels at $87,489 and $88,855.


