

XRP has fallen by more than 5% in the past 24 hours but is currently attempting a rebound and trying to break above the $2 level. After reaching an oversold RSI level earlier today, the token is showing initial signs of recovery amid macro headline changes.
While a bearish configuration is appearing on the Ichimoku chart, momentum could enable a short-term rebound. However, strong resistance zones remain above, and whether XRP can sustain this rebound depends on technical breakouts and overall market sentiment.
XRP RSI Rising After Oversold Level
XRP's Relative Strength Index (RSI) is currently located at 44.24, having briefly dropped to 17.80 earlier today before rebounding. This was the lowest level in weeks and followed a price recovery after news that Trump is considering suspending tariffs for 90 days for all countries except China.
Just a day ago, the RSI was at 46.97, reflecting the sharp volatility XRP has experienced during recent market sell-offs. RSI is a momentum indicator used to identify whether an asset is overbought (above 70) or oversold (below 30) on a scale from 0 to 100.
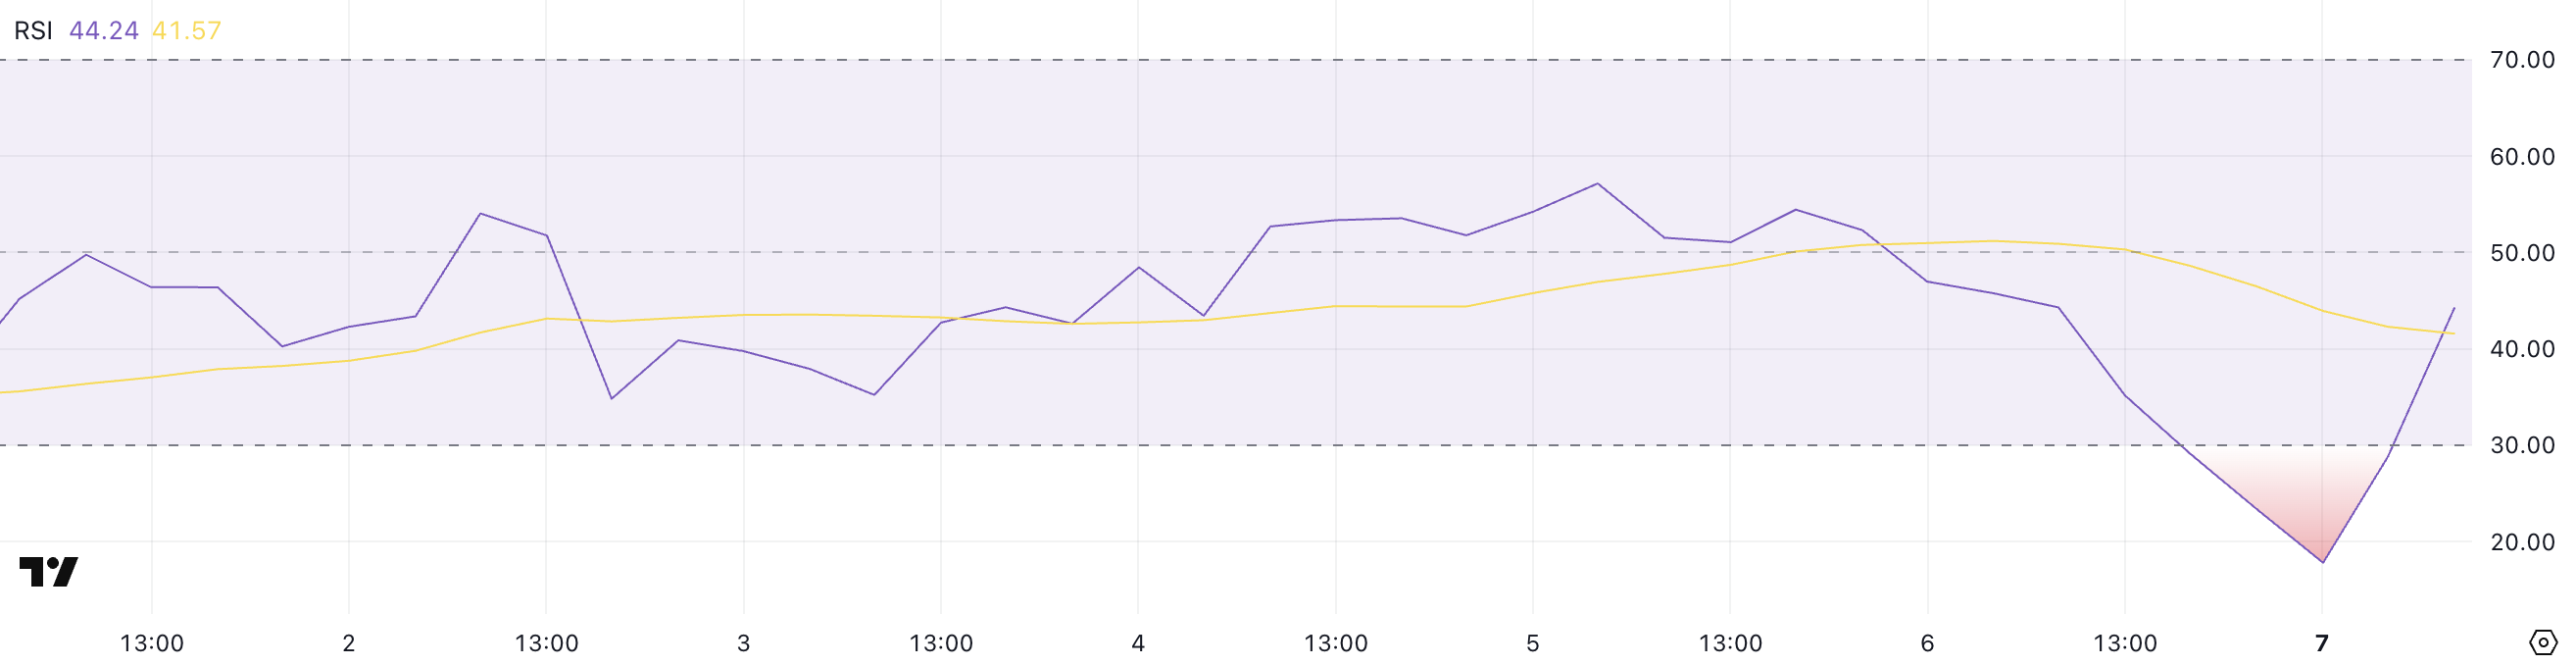
An RSI of 44.24 indicates XRP is in a neutral zone, which could alleviate selling pressure but momentum remains weak. Importantly, XRP has not entered the overbought area for almost three weeks, suggesting a lack of sustained upward momentum.
If the RSI continues rising and crosses 50, it could indicate a strong uptrend and potential price recovery. However, if it stalls or declines, XRP might struggle to find direction in the short term.
XRP Ichimoku Chart Shows Downtrend… Recovery Possible?
XRP's Ichimoku chart reveals a bearish structure. The price is trading below the cloud (Kumo), indicating strong downward momentum.
The Conversion Line (blue line) and Base Line (red line) are tilted downward and positioned above the current price, acting as dynamic resistance levels.
The preceding cloud is red and wide, suggesting continued bearish pressure with almost no immediate trend reversal signs.

However, recent bullish candles are pushing towards the Conversion Line, hinting at a potential short-term rebound or relief rally.
For a true trend reversal, XRP would need to break both the Conversion and Base Lines and eventually enter or exceed the cloud. With the current formation, this scenario seems distant.
Overall, the Ichimoku setup reinforces broader bearishness, and any upward movement is likely to face strong resistance from the cloud and key lines.
Will XRP Break $2.2?
XRP price recently fell below $1.80 for the first time since November 2024, reflecting strong market pressure and sharp sell-offs. However, the asset is showing recovery signs in the past few hours and attempting to regain momentum.
If this rebound gains strength, XRP could move towards the $2.02 resistance, and a successful breakthrough could open a path to higher levels around $2.23.
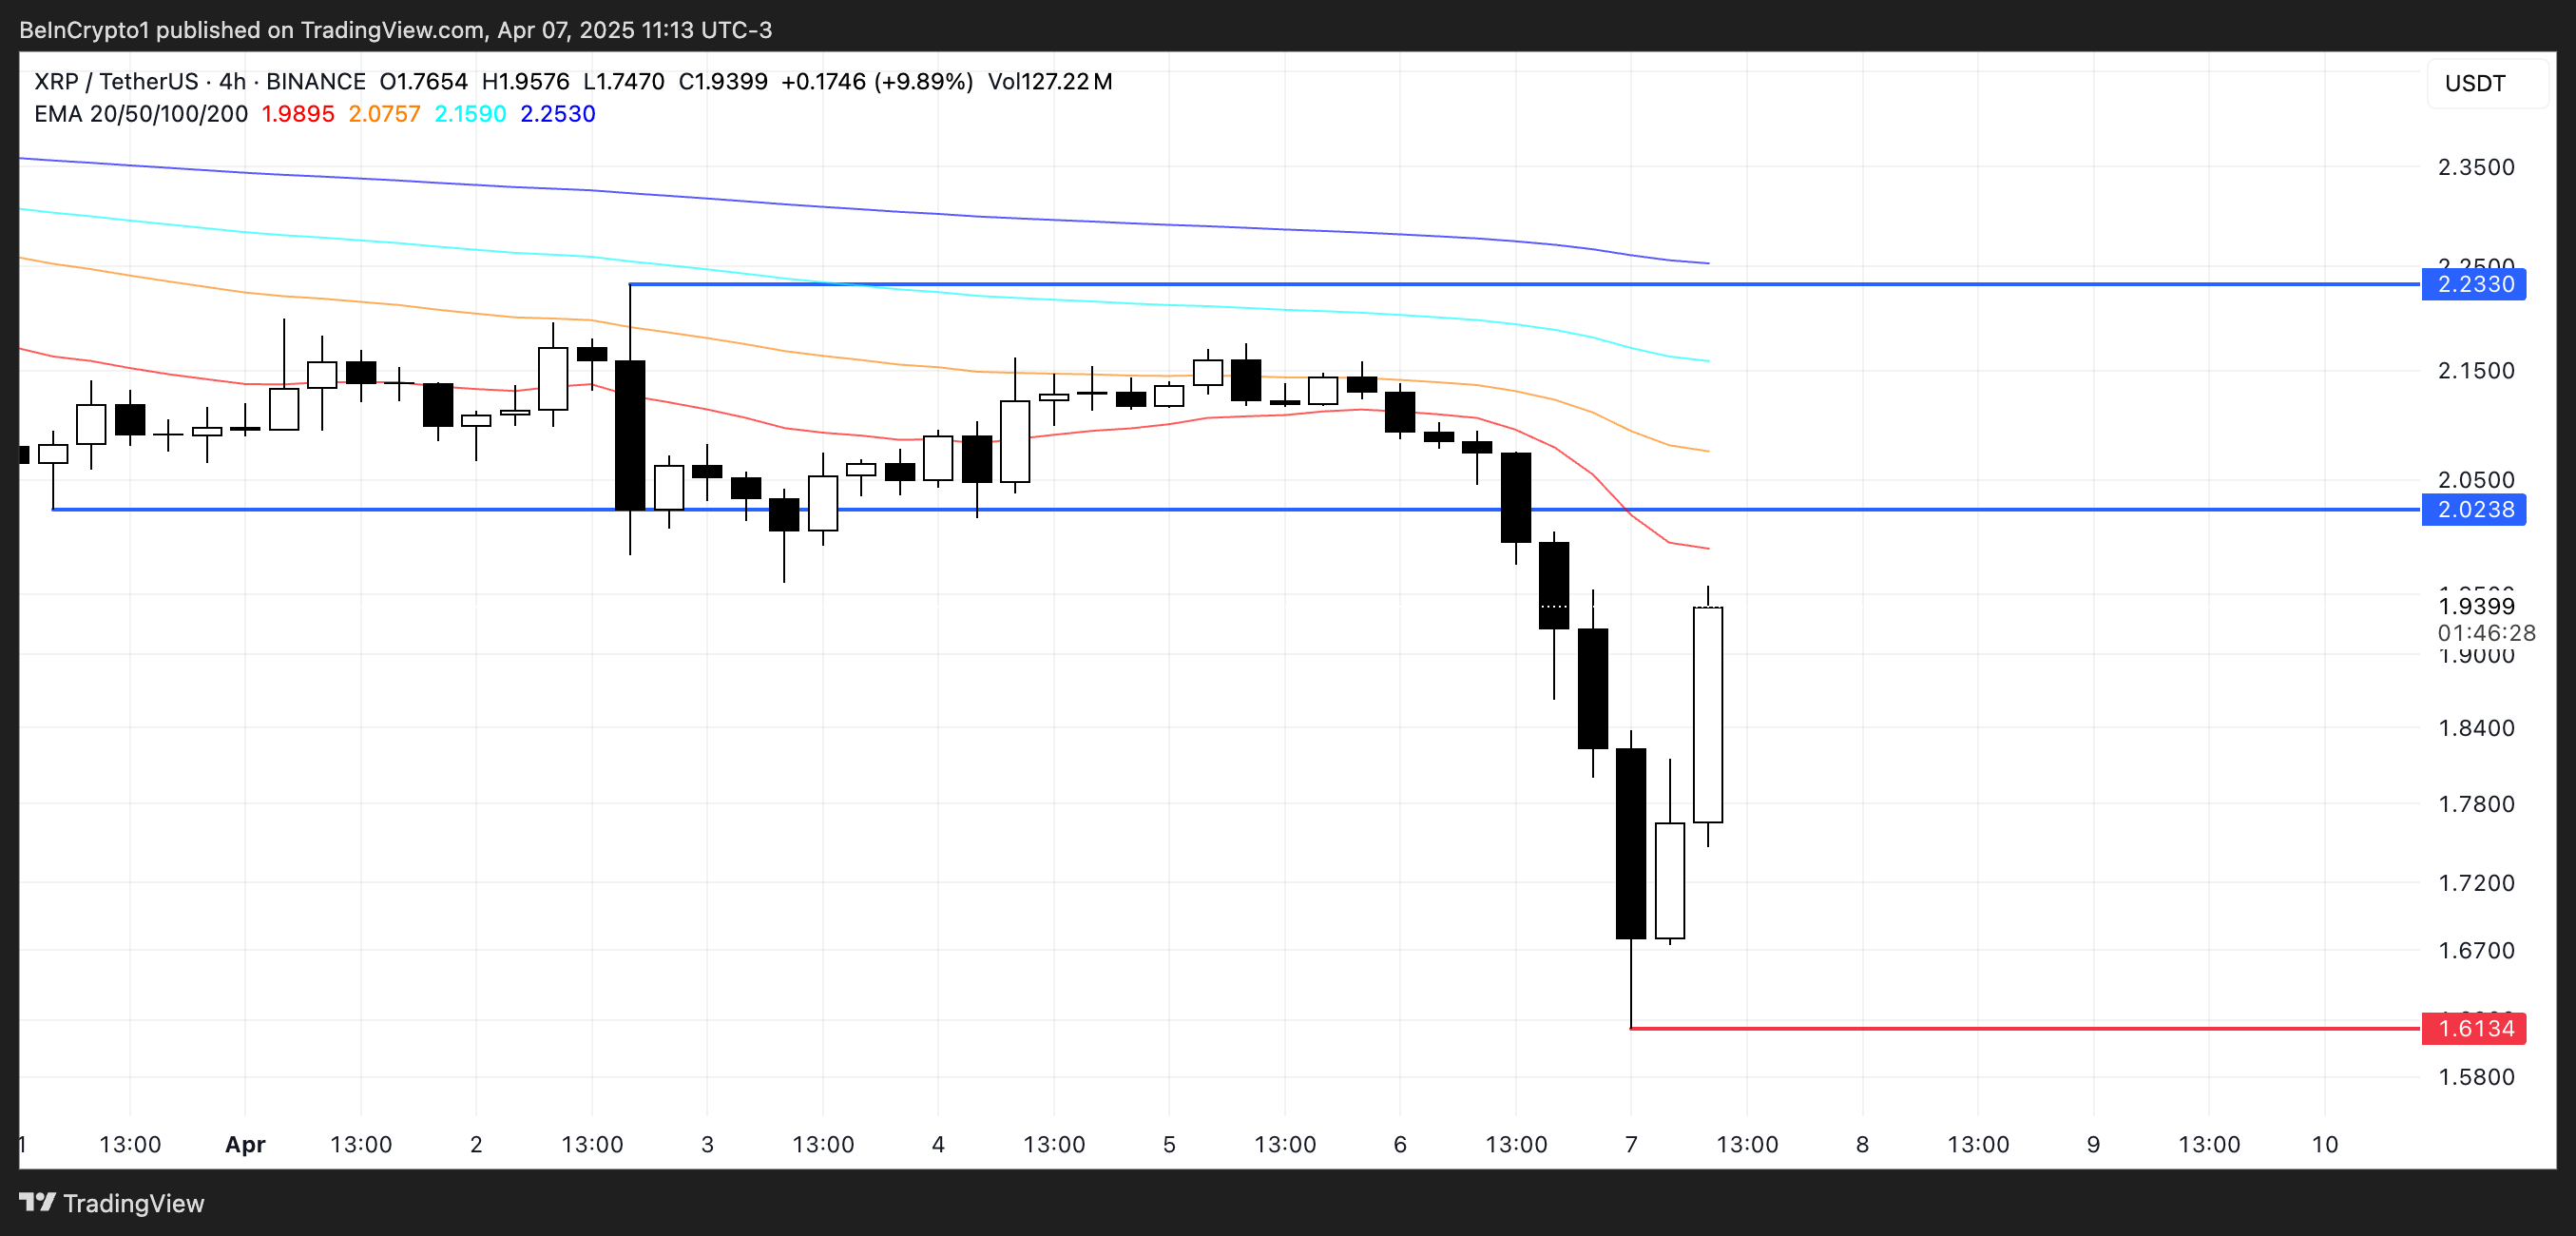
Conversely, if XRP fails to sustain its current recovery, the price could drop below $1.80 again and revisit support near $1.61.
A decline at that level could increase bearish pressure and potentially pull the price down to the $1.50 zone.


