

Ondo Finance (ONDO) has been showing strength, rising by more than 4% in the last 24 hours. Trading volume has increased by approximately 13% following the collapse of Mantra's OM token. This capital movement is working favorably for real-world asset (RWA) centered projects like ONDO, which is gaining momentum across several technical indicators.
A golden cross has formed on the EMA moving average. The DMI and CMF indicate increasing buying pressure and decreasing selling interest. As market sentiment recovers, ONDO could prepare for a breakthrough to $1.20 if it breaks through key resistance levels.
ONDO DMI Chart, Buyers Dominant
ONDO's DMI (Directional Movement Index) chart shows ADX declining from 36 to 28, indicating a weakening of recent trend strength.
While an ADX value above 25 still suggests a robust trend, the decline reflects a reduction in momentum following a strong directional movement.
These changes suggest the market may be entering a consolidation or hesitation phase while reassessing ONDO's next move.
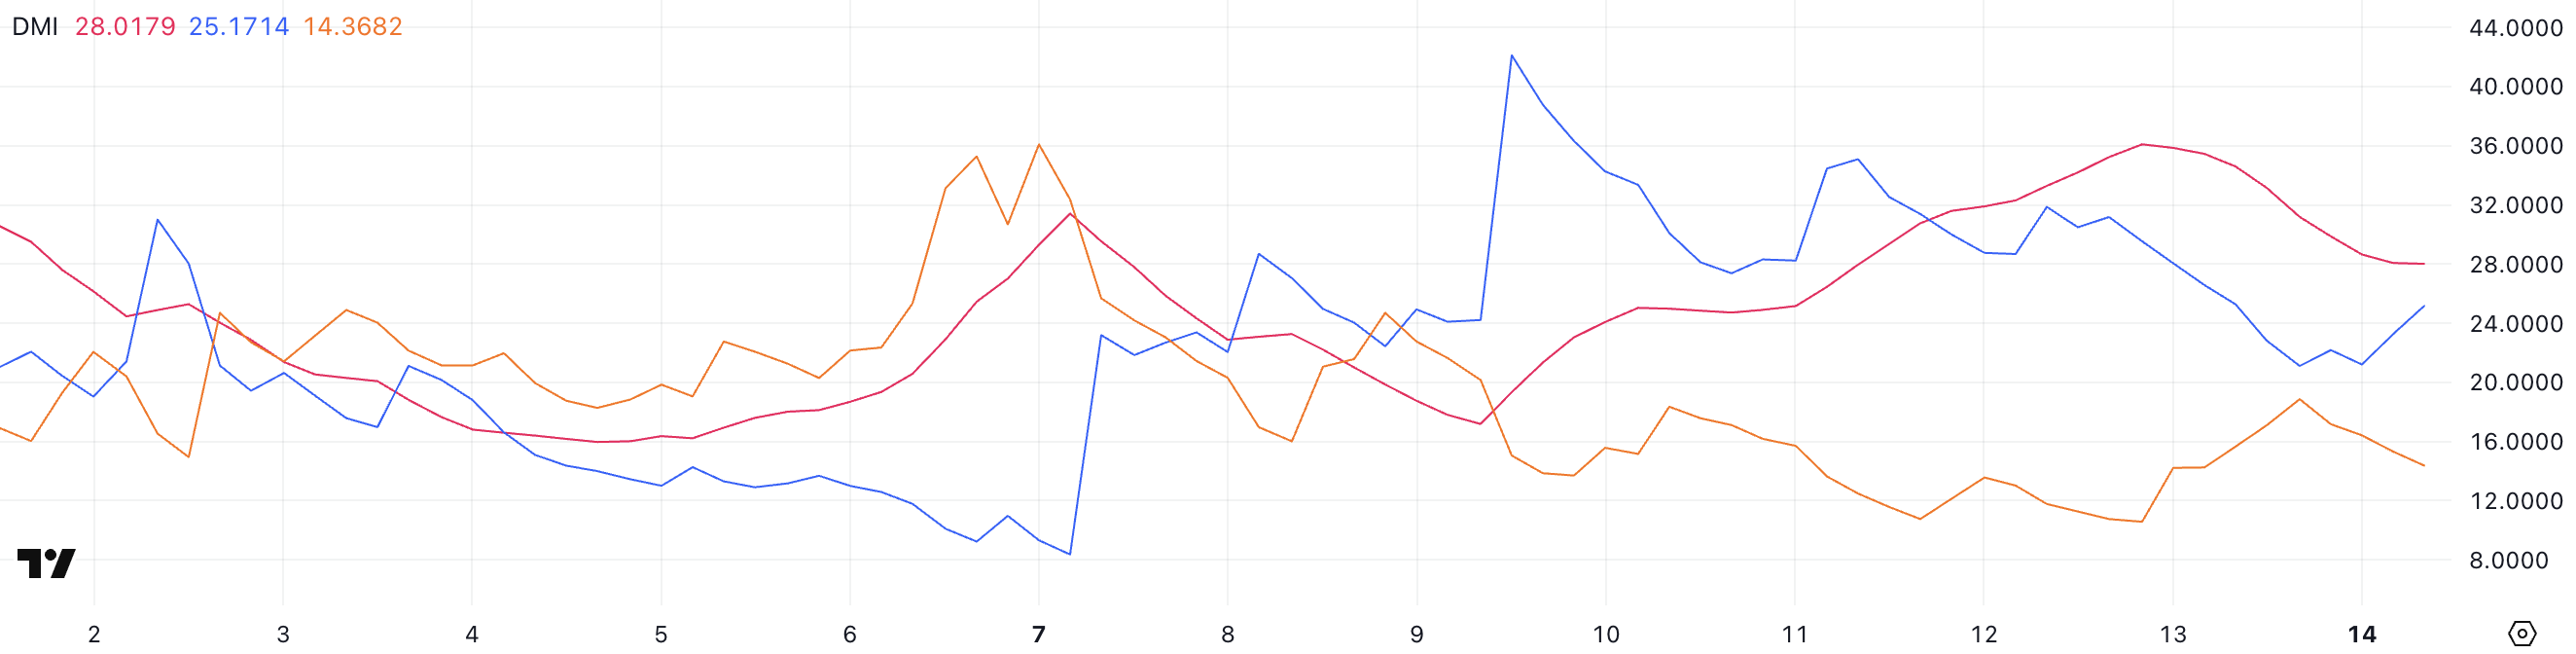
The +DI (positive directional index) tracking upward price pressure is currently 25.17, up from yesterday's 21.1 but still lower than two days ago's 31.18.
Meanwhile, the -DI (negative directional index) measuring downward pressure has dropped from 18.86 to 14.36, though still higher than two days ago's 10.56.
This combination suggests a partial recovery of buying pressure in the short term, while overall trend strength is cooling.
For ONDO, a potential recovery attempt may form. However, if the ADX does not stabilize or rise again, the trend remains vulnerable and a quick reversal could occur.
ONDO CMF, Growth After Touching -0.17
ONDO's Chaikin Money Flow (CMF) is currently at -0.06, sharply recovering from yesterday's -0.17.
CMF is a volume-based indicator using price movement and volume to measure an asset's buying and selling pressure.
Values above 0 indicate net buying pressure, while values below 0 reflect net selling pressure, helping to assess market sentiment strength.
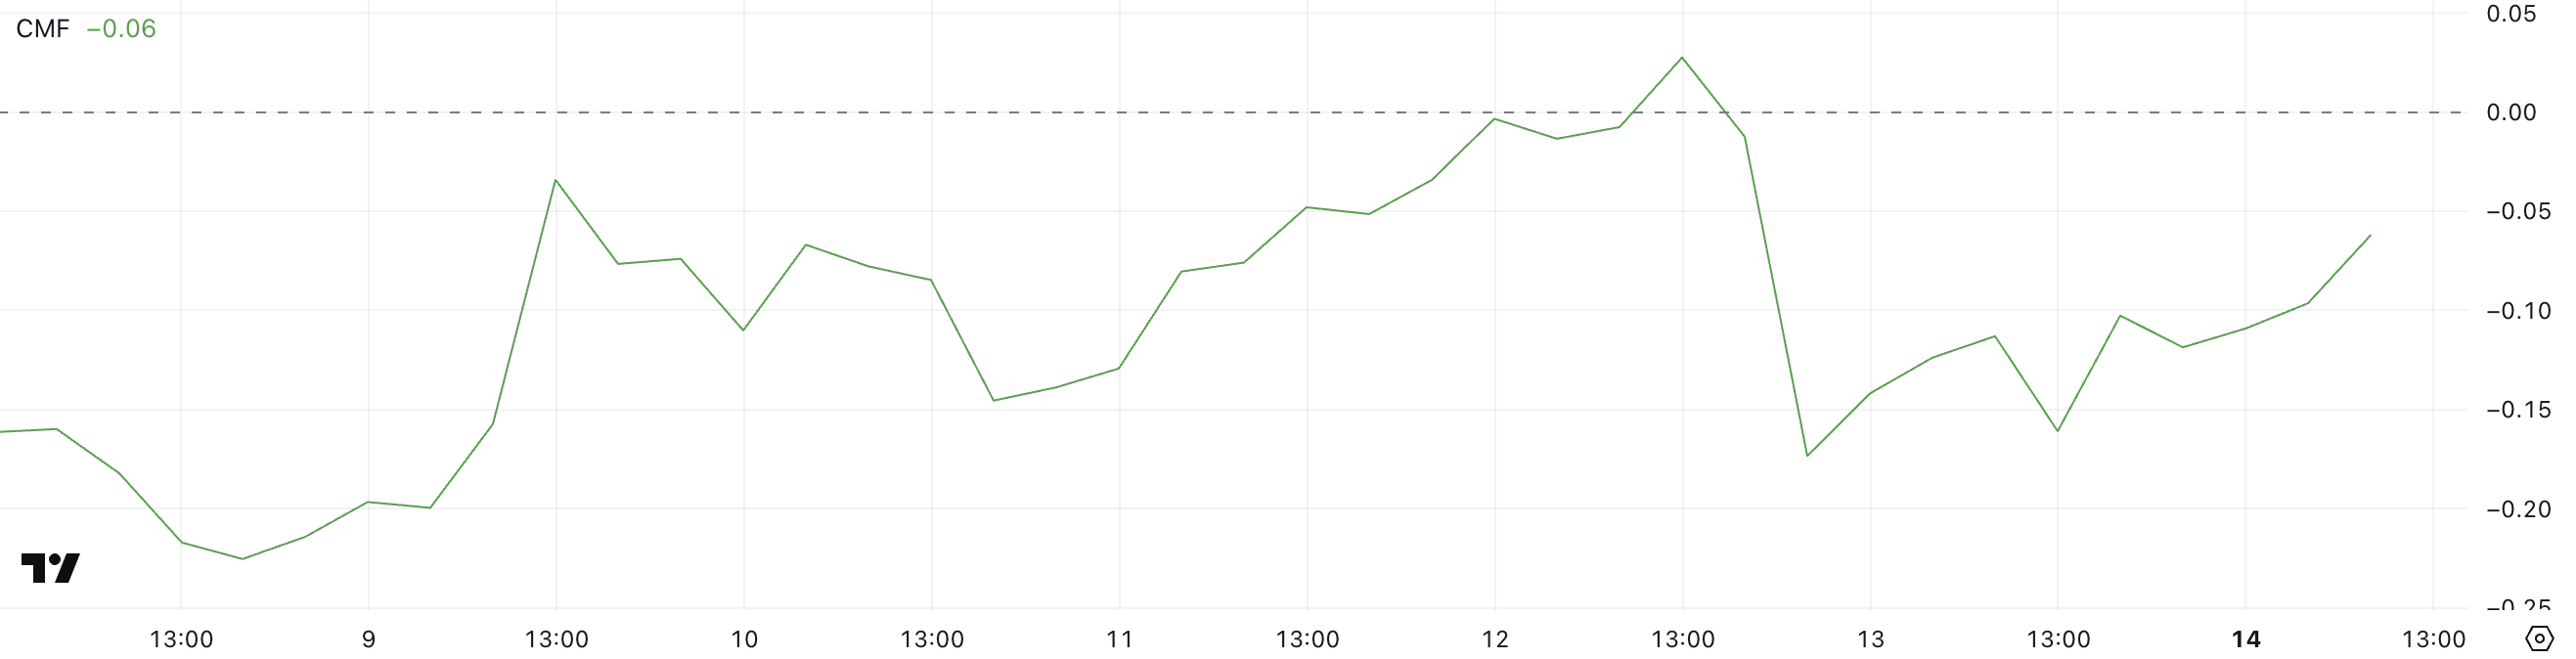
ONDO's CMF remains slightly negative, but a quick move towards the zero line suggests significantly weakened selling pressure and potential return of buying interest.
This surge may be related to changes in investor sentiment following Mantra's OM token collapse. Capital might be moving to RWA coins like ONDO.
While the current CMF still shows a cautious tone, the upward movement indicates improving market confidence. If sustained, it could support further price recovery.
Ondo, Will It Recover to $1.20 Soon?
ONDO's EMA moving average has just formed a golden cross, often indicating the start of a new upward trend.
This technical development suggests increasing upward momentum, likely to test the $0.956 resistance level in the short term.
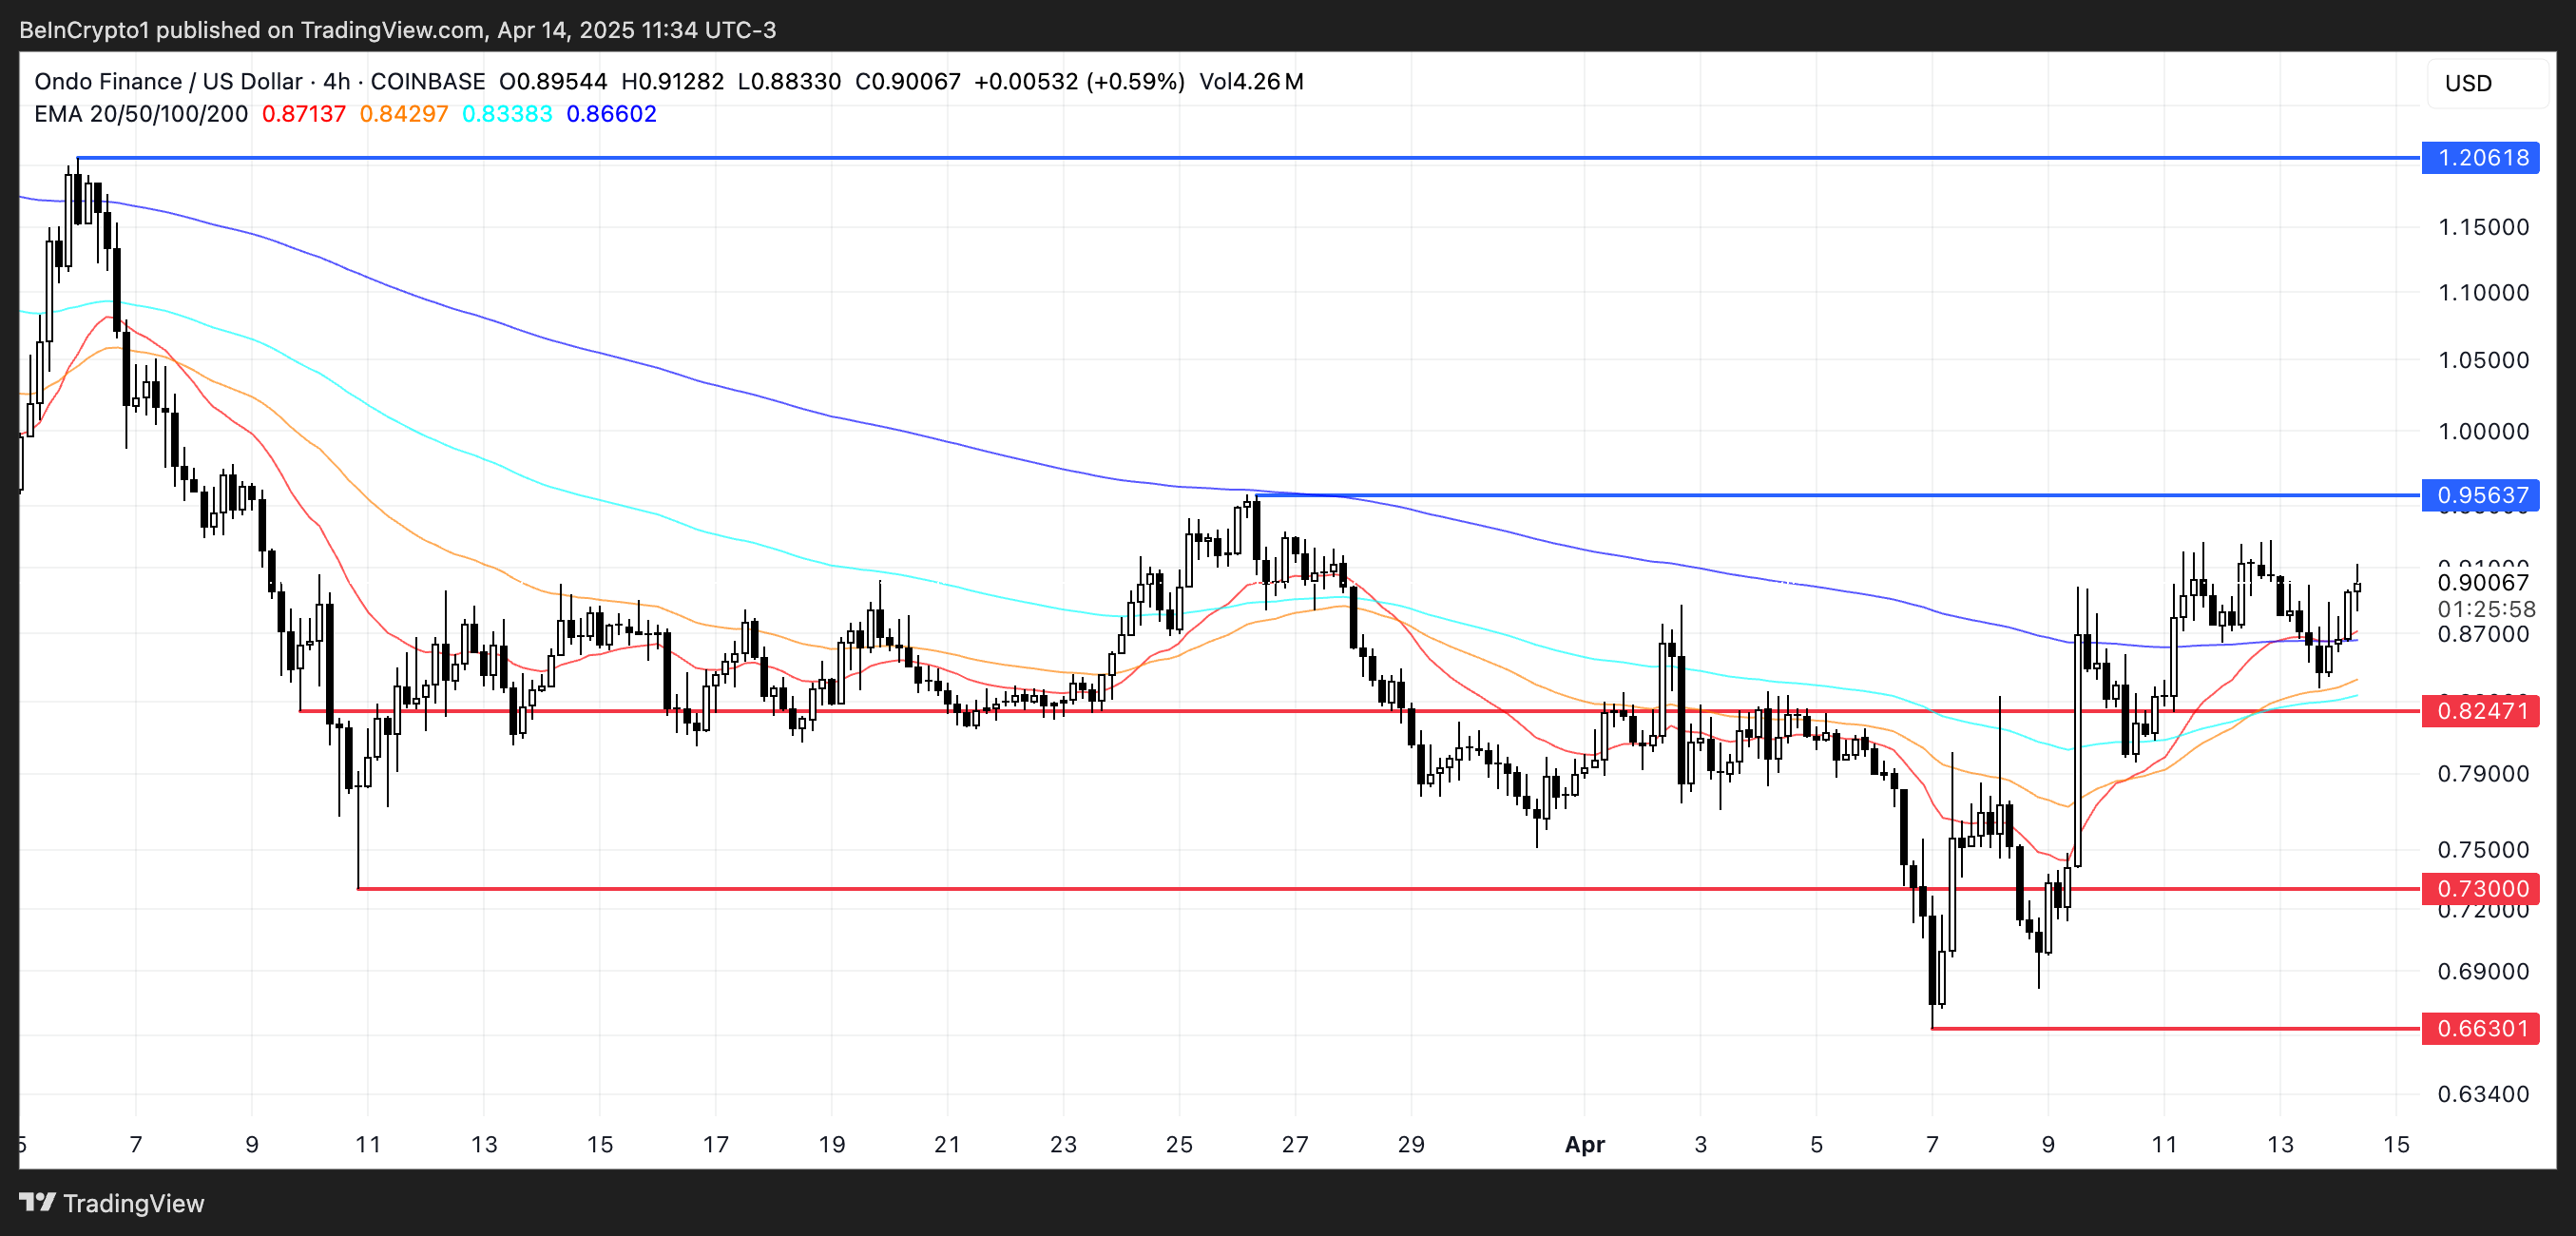
If resistance is broken, ONDO could gain additional upward momentum, rallying to $1.20 to strengthen bullish sentiment and attract more buyers.
If the RWA coin fails to maintain its current momentum and the price falls below the key support level of $0.82, selling pressure could intensify.
Dropping below that level could lead to a deeper correction to $0.73, and if that zone is not maintained, it could further decline to $0.66.

