

Bitcoin has reduced its drawdown from the peak to 21.87%, with the resistance level of $84,400 on the heatmap emerging as a key variable. After the halving, the increase rate has exceeded 32%, and breaking through the concentrated selling area could raise expectations for a technical trend reversal.
📉 Drawdown from ATH
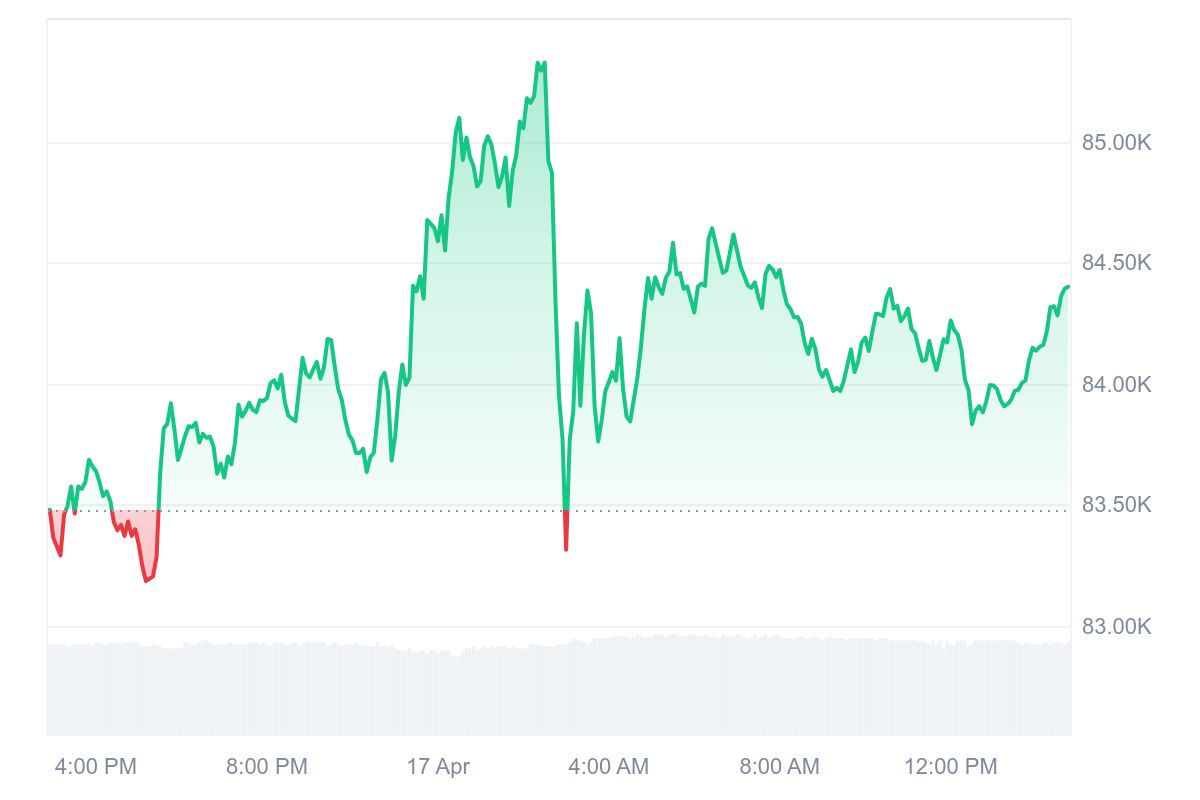
As of 2:53 PM on the 17th, Bitcoin is trading at $84,376, up 1.12% from the previous day. This is approximately 21.87% lower than the all-time high of $108,000 recorded on January 20th this year. The drawdown from the peak has further reduced from 24.40% last week.
📆 Days After Halving
Currently, 363 days after the fourth halving on April 20, 2024, Bitcoin has risen by 32.15%.
The halving is a major protocol event in the Bitcoin network where mining rewards are halved, occurring approximately every 4 years.
With market maturation, changes in liquidity environment, and ETF fund inflows creating new variables, the return rate has become lower compared to the past, but it has repeated similar price cycles due to supply factors before and after the halving.
Typically, the upward trend becomes more apparent from 6 months after the halving, with the strongest bull market developing between 12-18 months.
Following previous movements, 187 days remain until reaching the next peak (October 21st), and 552 days until the next cycle low (October 21, 2026).
The next halving is expected around March 2028, with approximately 1,053 days remaining from the current point.
🔁 Low-to-Low Comparison
Comparing the flow from the bottom (low point) of each cycle to the next low point, Bitcoin has risen 435% in the 879 days since the current cycle's low of $15,770 on November 21, 2022.
As both previous cycles had a similar low-to-low period of about 1,430 days, this indicator can be used as a reference for assessing entry into the latter part of the bull market.
If the pattern repeats, the end of the bull market would be around October 2026, with approximately 552 days remaining.
📍 Price Visit Frequency Heatmap
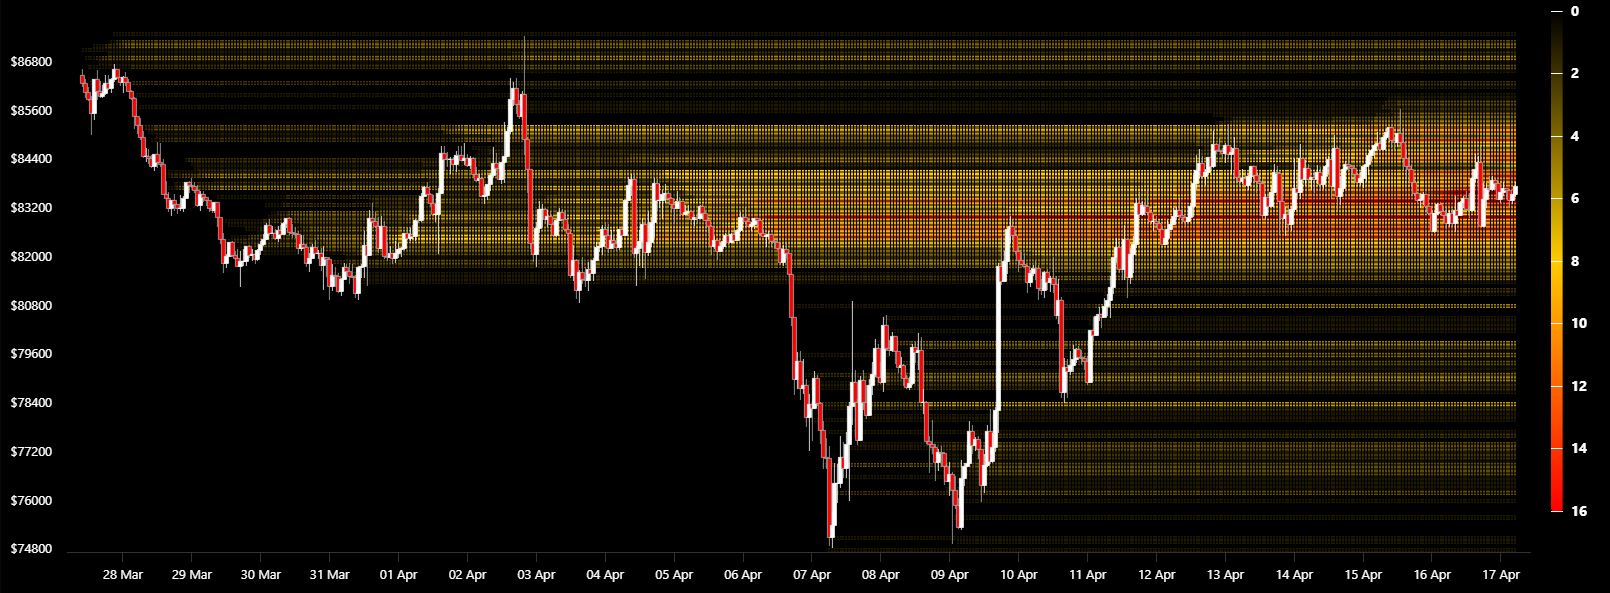
Heatmap analysis of Bitcoin's price range dwelling time and frequency shows that the current high-volume area is concentrated between $84,400-$84,600, while the low-volume area is between $82,200-$82,600.
This represents the range where market participants most actively traded, with the upper range likely acting as a resistance line and the lower range as a support line.
The area above $84,400, where selling volumes were previously concentrated, could act as a selling wall to prevent further rise, while around $82,200 is expected to have support as an area where buying pressure has accumulated.
Therefore, strongly breaking through the upper selling area could be seen as entering a range that could boost the upward momentum, while departing from the lower support line could open the possibility of a rapid decline.
The most prominent accumulated volume on the heatmap is around $83,300, an area where strong support and resistance have repeatedly occurred.
Considering that Bitcoin is trading above this concentrated volume area, the current range seems to be more focused on price stabilization rather than being oversold. Particularly, breaking through the $84,400 upper level appears to be crucial for a short-term trend reversal.
Entering the area above $85,000, where volume concentration is low, could potentially transition to an upward range with minimal short-term resistance. Conversely, falling below $82,200 could rapidly weaken volume support, opening the possibility of a quick adjustment to the $78,000-$80,000 range.
For real-time news...Go to TokenPost Telegram
<Copyright ⓒ TokenPost, Unauthorized Reproduction and Redistribution Prohibited>


