

Ethereum (ETH) continues to struggle below $2,000. This level has not recovered since March 28th. Technical and on-chain indicators show a continued downward trend. While attempting to stabilize, recent data reveals an increased concentration of ETH in whale wallets. Trend indicators like EMA lines also show continued weakness.
Simultaneously, retail and mid-sized holders are gradually losing their market share. This further intensifies the concentration of ownership among large players. If retail participation decreases and whale dominance strengthens, ETH could become vulnerable to sharp corrections if sentiment changes.
ETH Whale Holdings Reach 9-Year High… Centralization Concerns
The amount of ETH held by whale addresses has reached its highest level since 2015, with wallets controlling over 1% of total circulating supply reaching 46%.
This represents a significant change in Ethereum ownership data. Whales exceeded retail investors' holdings on March 10th and have continued to increase their share. Relatively, addresses holding 0.1% to 1% of supply and retail wallets holding less than 0.1% have decreased ETH ownership.
The sharp increase from 43% to 46% over a few months reflects a rapid accumulation trend among large holders, suggesting ETH is becoming concentrated in few hands.
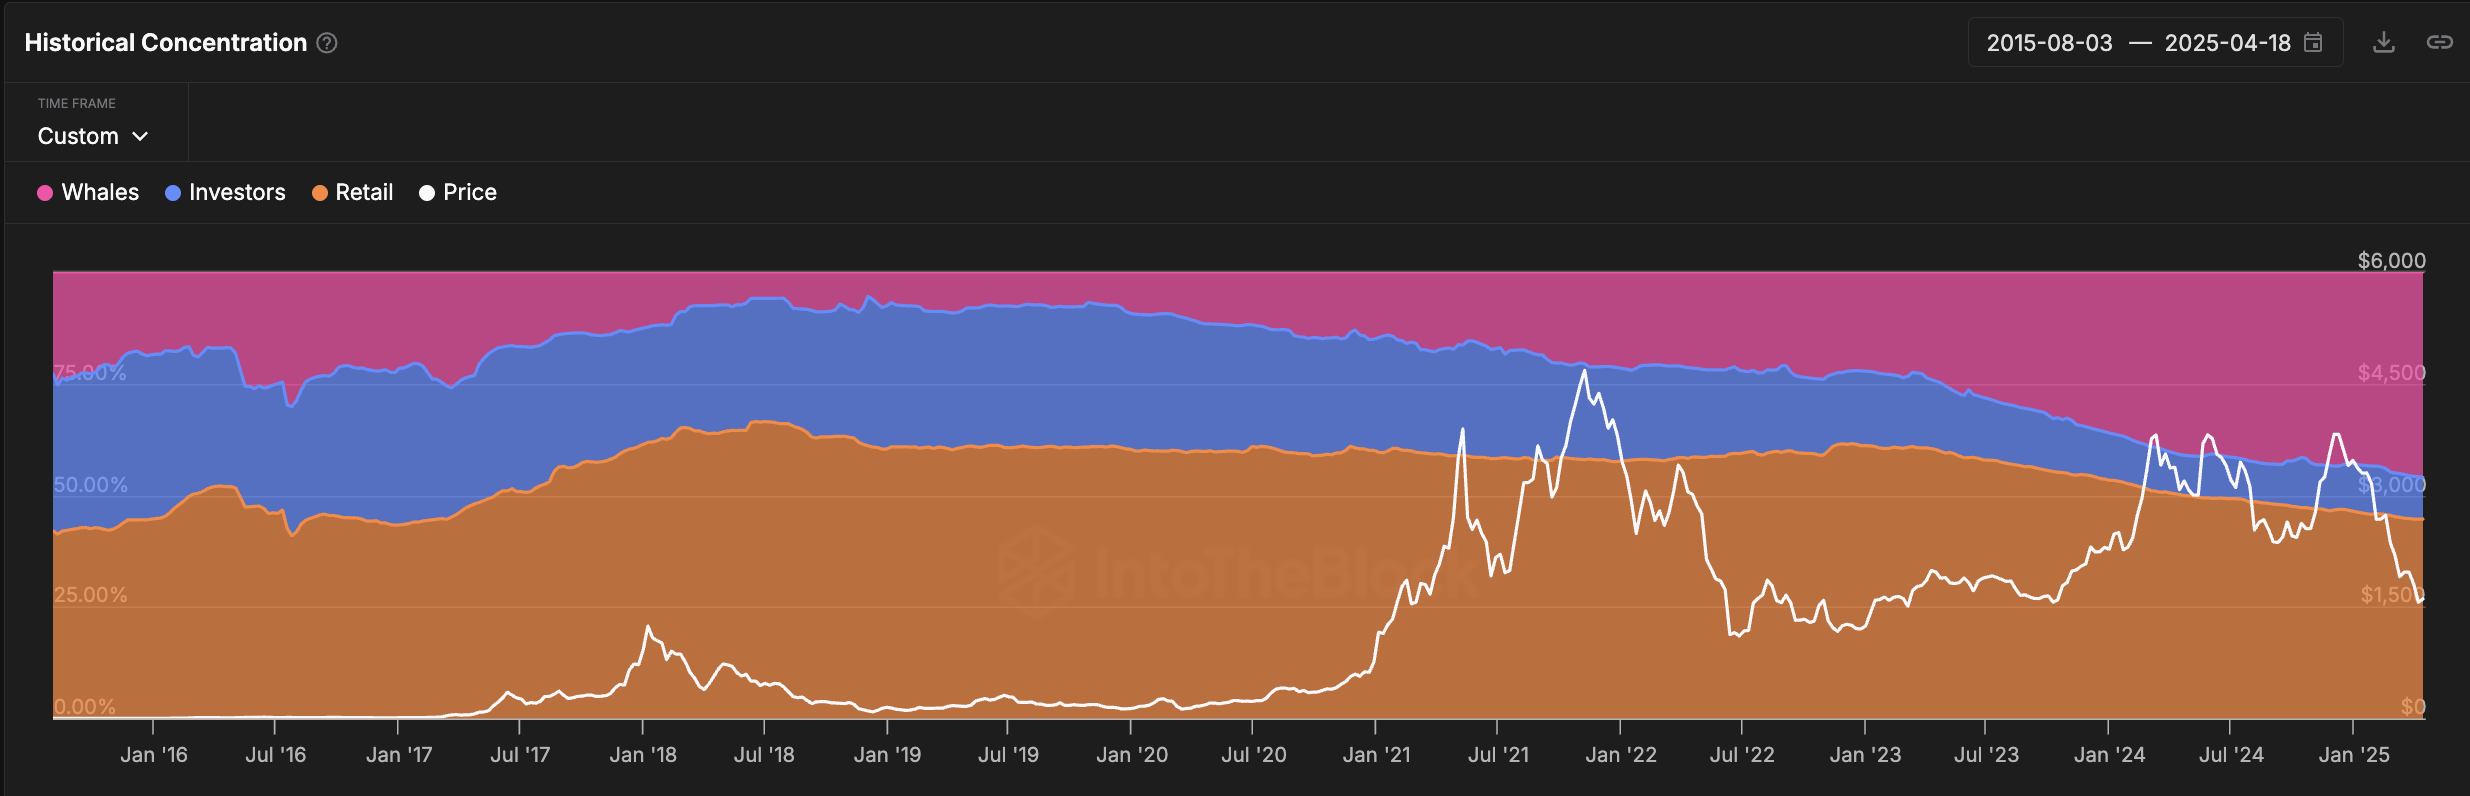
Whales typically represent institutional investors, funds, or early adopters. Their actions can significantly impact price due to the volume they control. Investor-level addresses often reflect high-net-worth individuals or small institutions, while retail addresses include everyday traders and holders.
While some may view the increase in whale holdings as a sign of confidence, the risk of sudden volatility increases if large holders begin selling.
With reduced retail and investor participation, the market could become more vulnerable, potentially exposed to abrupt and unexpected price fluctuations by a few dominant players.
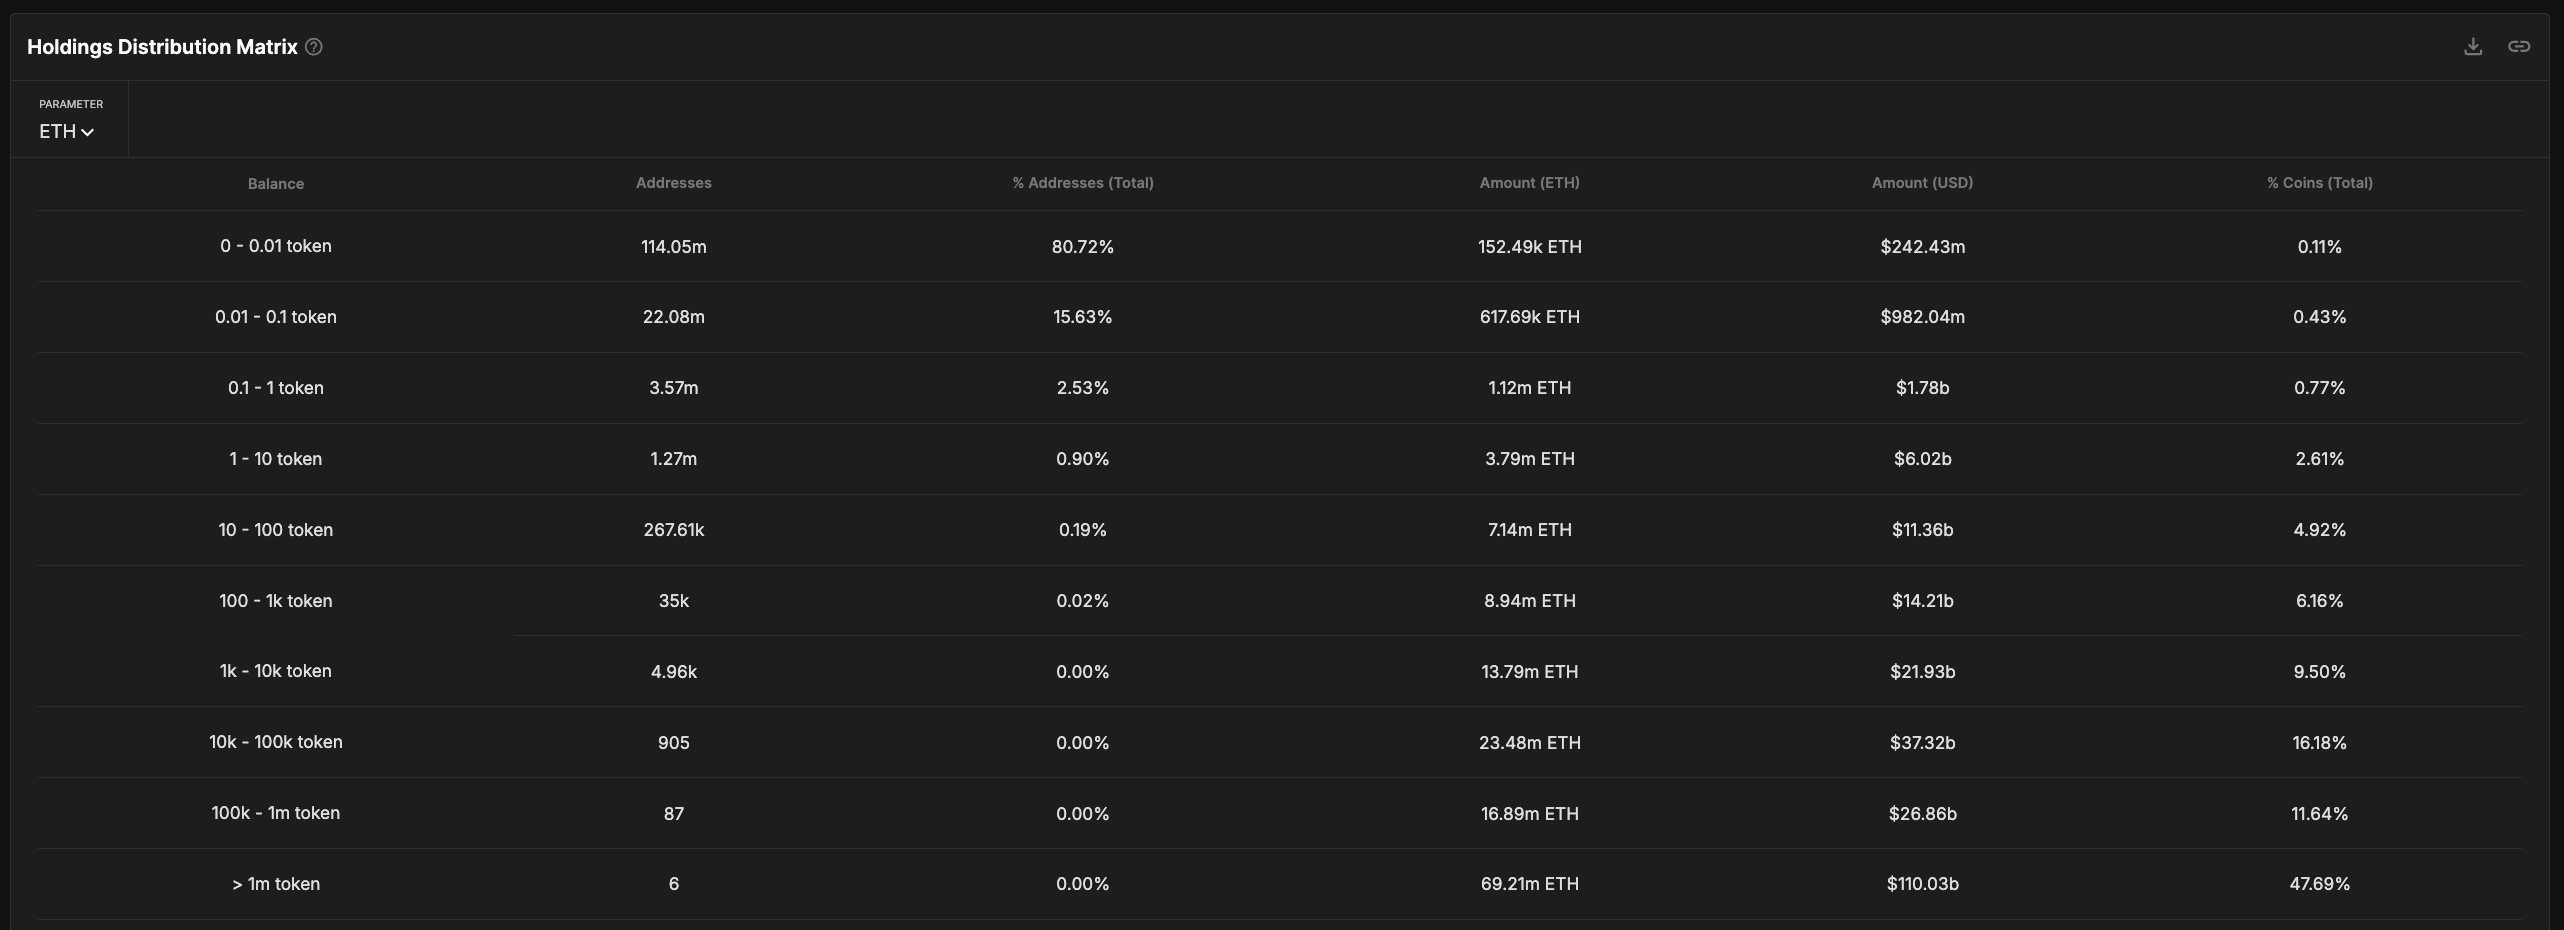
Whales Holding 1,000-100,000 ETH Control $59 Billion
Analyzing the ETH holding distribution matrix reveals deepening concentration.
Excluding addresses with over 100,000 ETH connected to centralized exchanges, whale addresses holding 1,000 to 100,000 ETH currently control approximately $59 billion in ETH, representing about 25.5% of circulating supply.
This group is steadily accumulating network supply, reinforcing the power shift to large institutions operating outside exchanges. Recently, Galaxy Digital moved $100 million in Ethereum, raising questions about whether this is a strategic move or a selling signal.
Some may interpret this trend as strategic positioning by confident holders, but it also exposes Ethereum to significant downside risk.
With over a quarter of the supply concentrated in these whales' hands, coordinated selling or panic selling could trigger sharp price declines, especially in an environment of weakened retail participation.
Rather than a signal of long-term stability, this level of concentration makes the ETH market increasingly vulnerable and exposed to volatility if these holders begin moving capital to other assets.
Declining EMA Structure Pressures ETH
Ethereum's EMA (Exponential Moving Average) lines continue to send bearish signals. Short-term averages remaining below long-term averages indicate a continuing downward trend.
In a new correction, Ethereum might first test support at $1,535. Falling below that level could lead to deeper declines to $1,412 or even $1,385.
If these support levels don't hold, Ethereum could dangerously approach $1,000, a potential downside target identified by some analysts if the market enters a long-term correction.
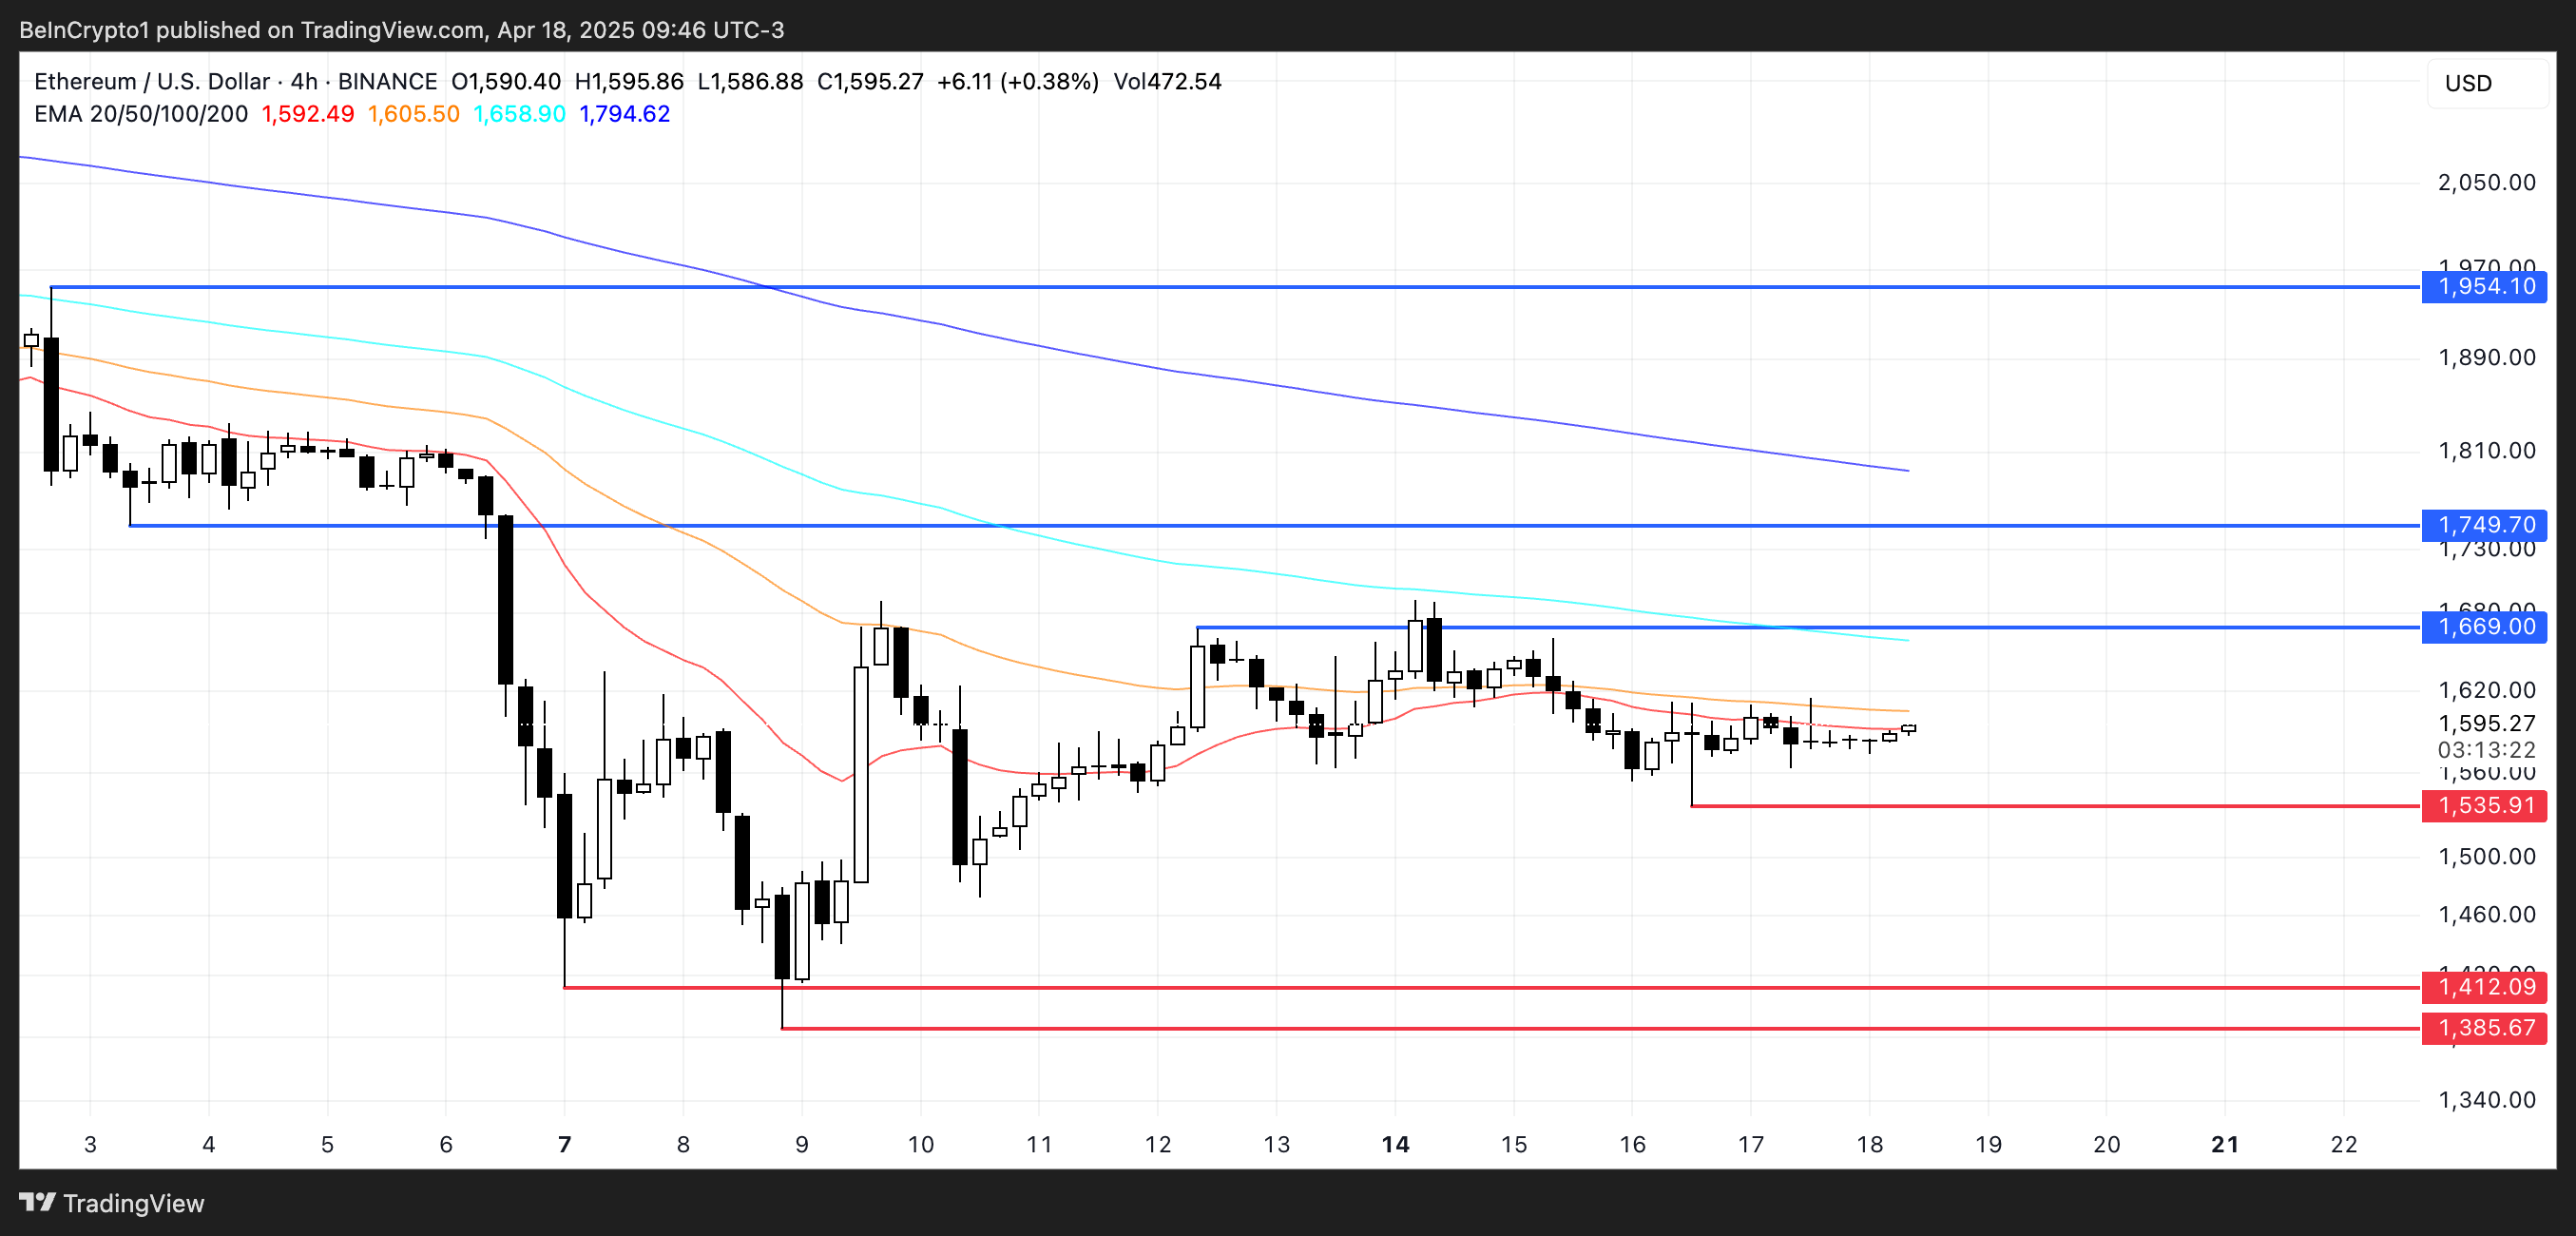
However, the possibility of a bullish reversal cannot be completely ruled out. If buying pressure returns and Ethereum recovers short-term momentum, it could test the resistance level at $1,669.
Breaking through this could be a significant technical signal, potentially pushing Ethereum's price to $1,749 and even $1,954.
However, with EMA still showing a downward trend, it remains for buyers to definitively prove a momentum shift.


