Bitcoin (BTC) has broken through $90,000 for the first time since March 5th. Momentum indicators are increasingly showing strong signals. The recent surge occurred while ADX was rising sharply, forming a bullish Ichimoku chart, and EMA alignment continues to support ongoing growth.
As buying pressure surpasses selling activity and ETF inflows reach a three-month high, market sentiment is tilting towards bullishness. If resistance is broken, BTC could pave the way to $100,000, which would strengthen its hedge role amid broad market uncertainty.
Bitcoin Reclaiming Bullish Market…ADX Rising Signals
Bitcoin's Directional Movement Index (DMI) is signaling significant momentum changes. ADX has sharply risen to 29.48, up from 15.3 two days ago.
ADX, or Average Directional Index, measures trend strength regardless of direction. Values below 20 indicate weak or sideways markets, while values above 25 suggest a strong trend is forming.
With ADX approaching 30, the current movement is gaining momentum and confirming a clear directional trend.
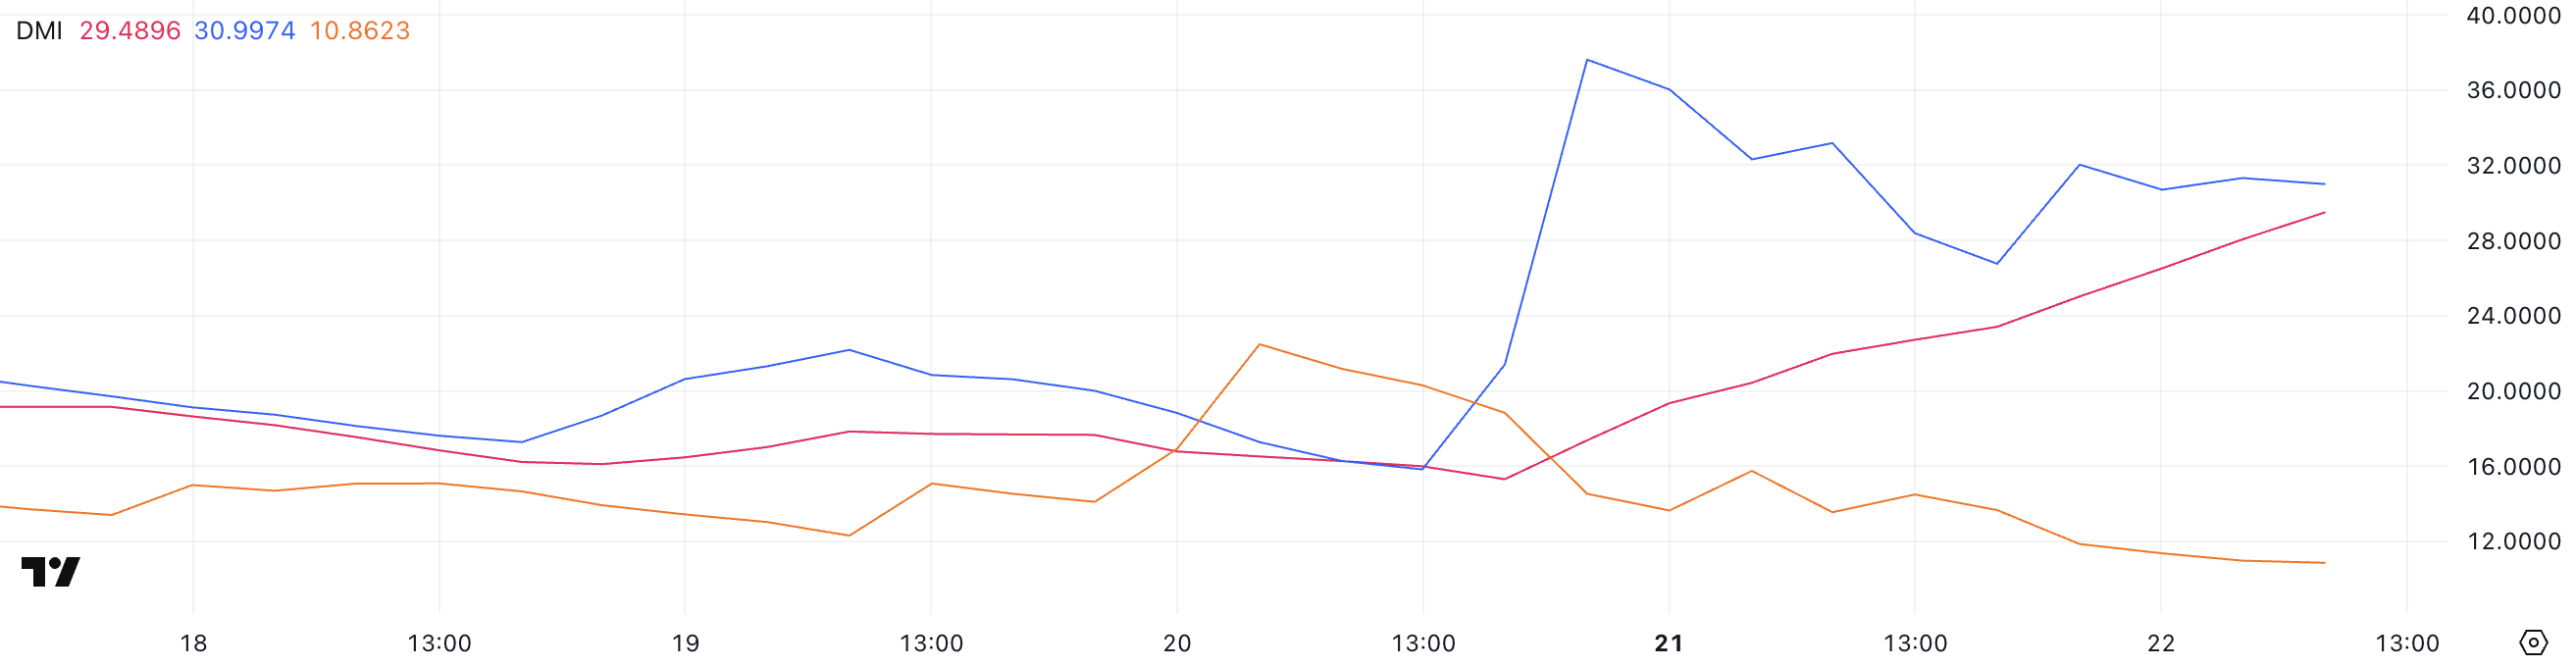
Diving deeper into DMI components, +DI (Positive Directional Indicator) is currently at 30.99, nearly doubling from 15.82 two days ago and slightly down from yesterday's 37.61 peak.
This suggests recent buying pressure surged but slightly eased in the past 24 hours. Meanwhile, -DI (Negative Directional Indicator) has sharply dropped from 22.48 to 10.86.
The strong ADX and high +DI combined with a declining -DI implies current bullish momentum. If the trend maintains, Bitcoin could continue its short-term upward trajectory.
Bitcoin Trend Strengthening…Clear Upward Momentum Signal
Bitcoin's Ichimoku chart shows clear bullish signals. Price movement is above the cloud, indicating strong upward momentum.
The cloud itself is transitioning from red to green, signaling a shift from bearish to bullish.
The conversion line (blue line) remains above the base line (red line), reinforcing short-term bullish bias. The widening gap between the two lines indicates strengthening momentum.
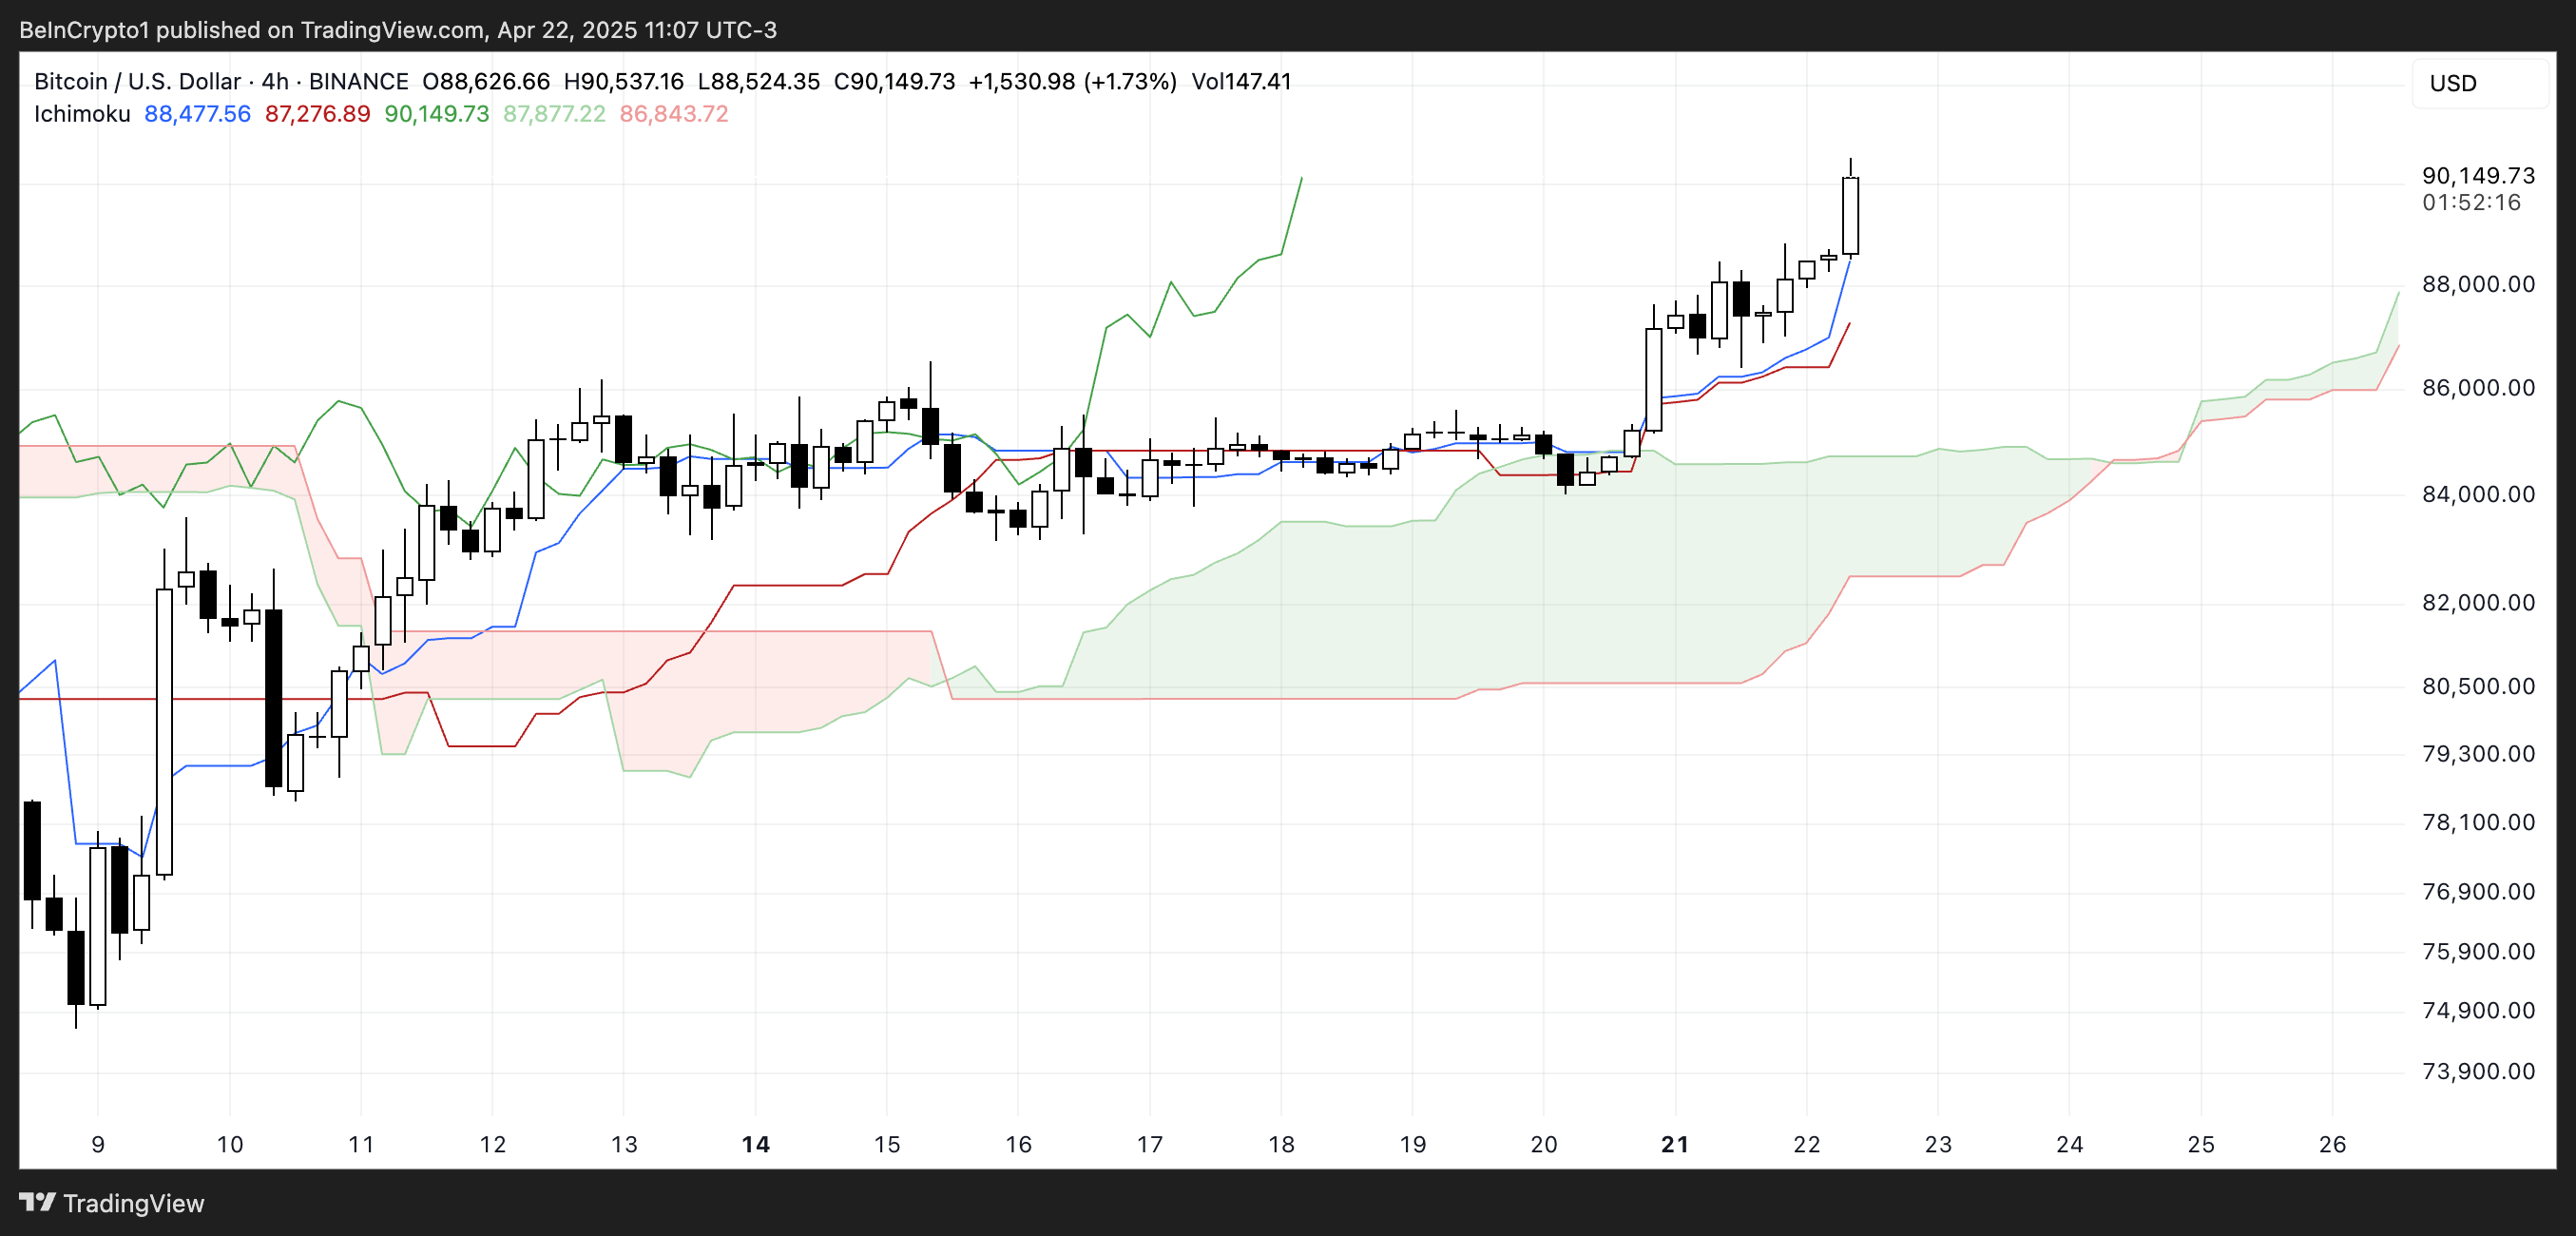
Additionally, the future cloud (Leading Span A and B) is tilting upwards, suggesting the bullish trend could continue if current conditions persist.
The lagging span (green line) is also positioned above price candles and the cloud, confirming trend alignment from a lagging perspective.
These elements point to a healthy upward trend, with no immediate reversal signals unless a strong drop below the conversion line or cloud occurs.
Bitcoin, Bullish Momentum…New Breakout Anticipated
Bitcoin's EMA lines show strength, with short-term averages positioned above long-term averages, signaling strong upward momentum.
Bitcoin's price is approaching the key resistance level of $92,920. Breaking this zone could open doors to further increases.
With strengthening buying pressure, it could reach a potential target of $96,484, as Bitcoin ETFs record their largest three-month inflow.
The current structure suggests bullishness is leading as long as support levels hold and upward momentum continues.
According to Tracy Jin, COO of cryptocurrency exchange MEXC, Bitcoin's recent performance is reviving the "digital gold" label:
"Bitcoin's recent strength is reviving the long-dormant 'digital gold' status amid market-wide volatility. With US stocks falling back to tariff-era lows and the dollar dropping to a three-year low, Bitcoin's profitability is reshaping investor perception," Jin told BeInCrypto.
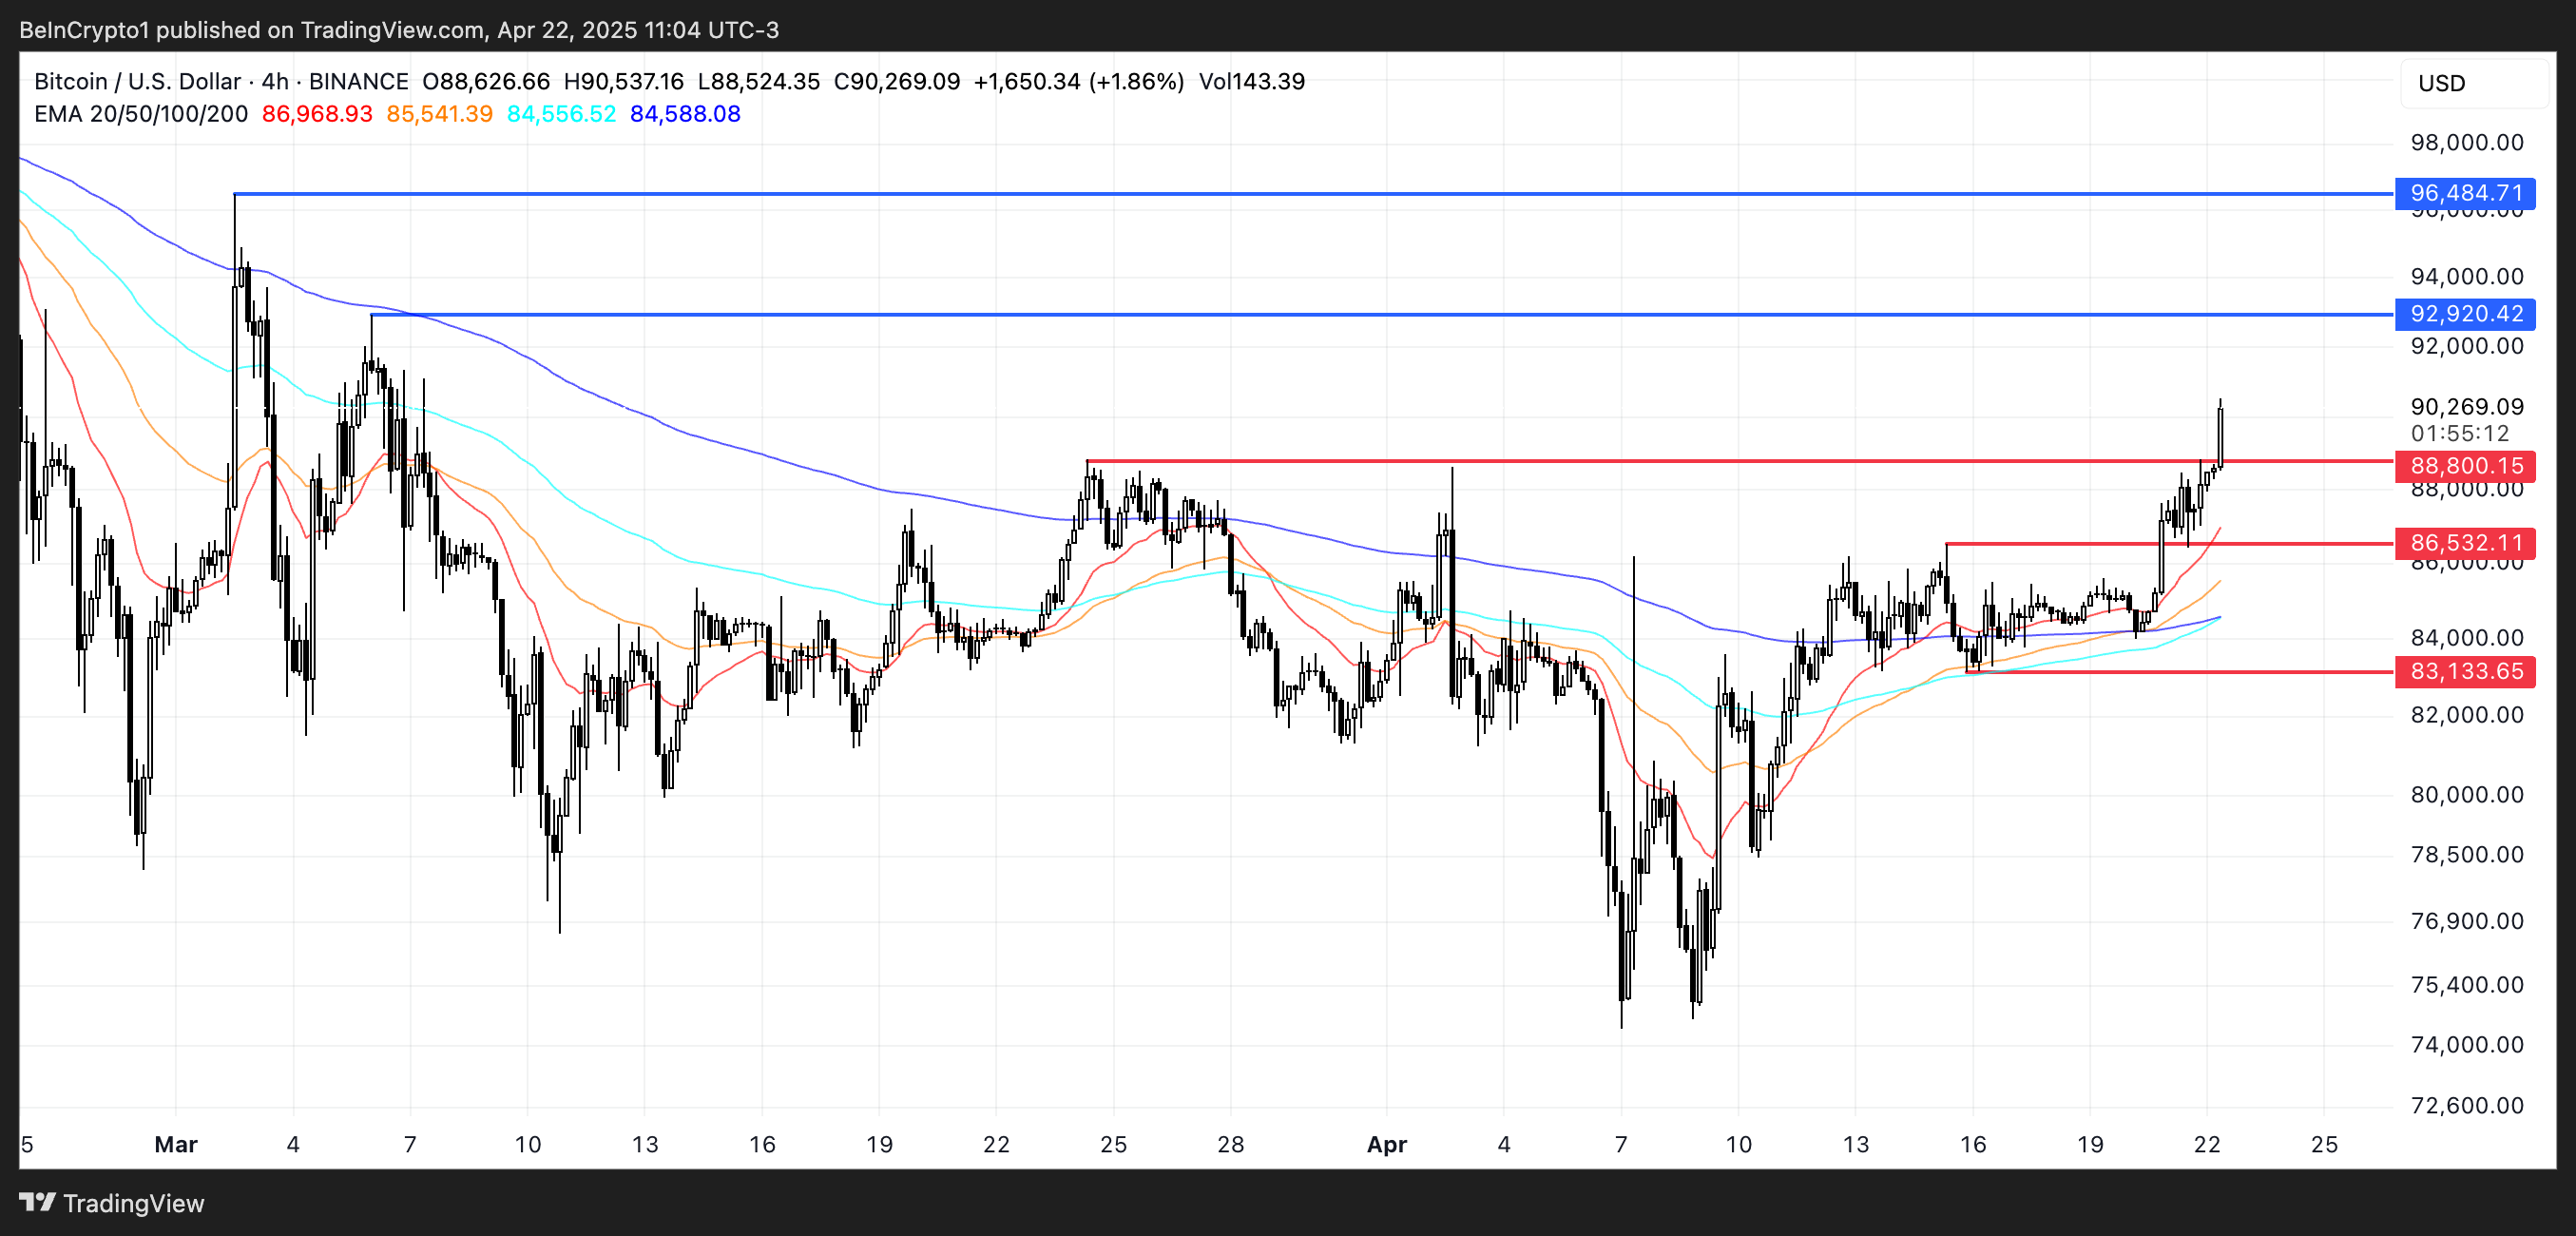
However, if the trend weakens and a reversal occurs, Bitcoin could retreat to the $88,800 support level in the short term.
Falling below this level could weaken the structure and increase the possibility of deeper correction. The next key areas to watch are $86,532 and $83,133.