

Bitcoin has significantly reduced its decline from its peak by 13.34%, with the resistance line at $84,400 on the heatmap emerging as a key variable for a short-term trend reversal. The rise after the halving has reached 46.58%, and a strong breakthrough of the concentrated sell-off area could increase expectations for trend reversal>
Drawdown from ATH
As> trading at, as of the 24th up, 0.01% from day. This is approximately 13.34% lower than the all-high of $108,,000 000 recorded on January 20 this year. The drawdown from the peak has significantly narrowed from 21.87% in the previous week,, showing a strong retrendback.
Days After Halving
Currently, 370 days after the fourth halving on April 20, 2024, Bitcoin has risen approximately 46.58% from the halving day price ($63,850).
The halving is a major protocol event where mining rewards are halved, occurring approximately every 4 years.
While various factors such as market maturity, liquidity changes, and ETF inflows have lowered returns compared to the past, the similar cycle repetition based on supply reduction is maintained.
Typically, the upward trend becomes clear from 6 months after the halving, with the strongest bull market tendency occurring between 12- months.
Following the past trends, followed the next peak date is around October 21, 2025 (approximately 180 days later), and the next cycle cycle low is expected around October 21, 2026 (approximately 545 days later). The next halving is on March 6, 2028, with approximately 1047 1days remaining.
Low-to-Low Comparison
Comparing the flow from the bottom (low point) of each cycle to the next low point, the low point of this cycle was recorded at $15,770 on November 21, 2022, and Bitcoin has risen approximately 493% in the 886 days since then. In the past
Since both previous cycles had similar intervals of about 1430 days between this indicator can be used as a reference to determine whether the bull market is entering its later stage.
If the pattern repeats, the end of the bull market would be around October 2026, with approximately 545 days remaining.
p>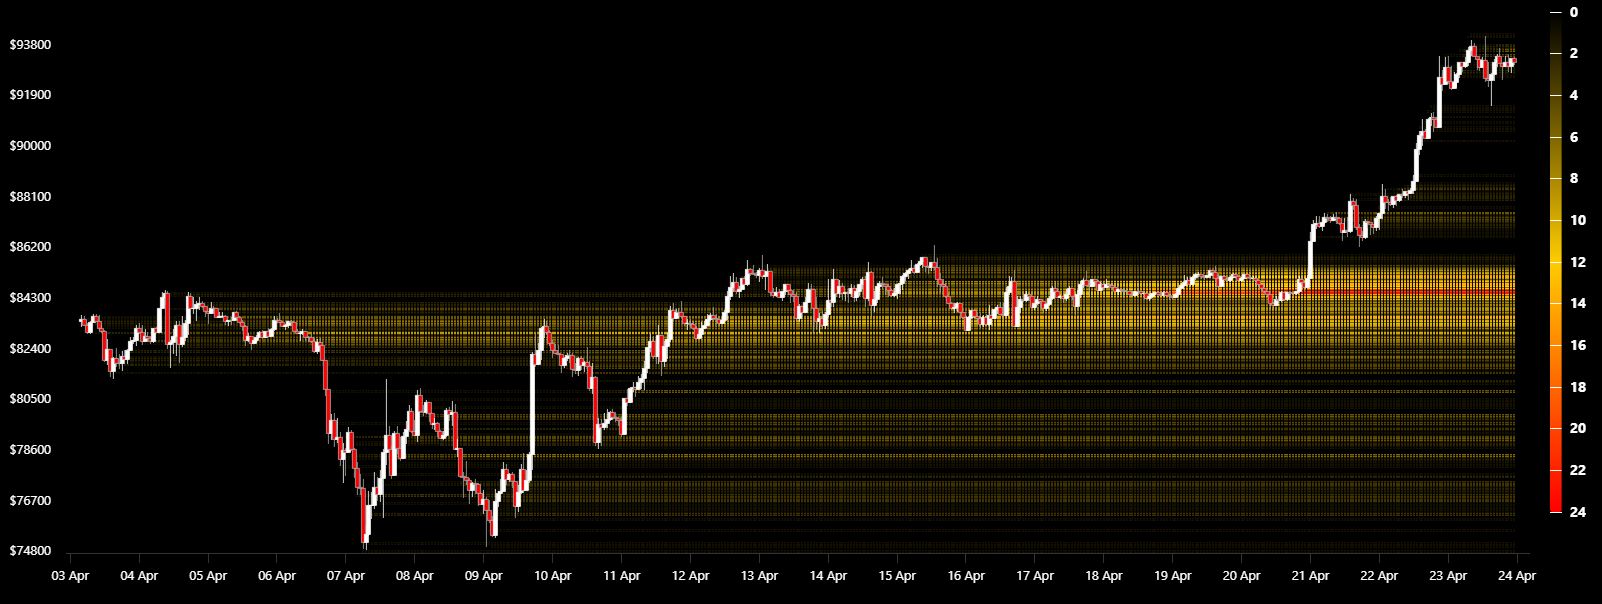
According to the Bitcoin price visititation frequency heatmap analysis, the most concentrated sell-off areas where market participants stayed the longest are between $82,200-$82,600 (support line) and $84,400-$84,600 (resistance line).
The most accumulated trading price is around $83,300,, which has been a core axis where support and resistance have repeatedly intersected.
Currently, Bitcoin has risen to $93,and590, surpassing all these concentrated sell-off areas. This is interpreted as a zone of settling after breaking through an important resistance line rather than short-term overbought, and the the market has entered a stage of being tested for future upward momentum strengthening.
Bitcoin has already broken through the area above $85,000, which was a 'sell-off void' area with low previous trading making it easy for prices to rise quickly rise quickly without resistance. The heatmap also shows that the area above $93,000 has a lighter color, suggesting it was easier for short-term additional rises.
However, whether a new sell-off area forms around $95,000 could be variable trend continuity going forward. Conversely, if it falls and breaks below $82,support200 line, a rapid adjustment to the $78,000-$80,000 range cannot be ruled out.
div div strong>>To get the news in real-..time href https me/tokenpost_kr" rel="nofollow">Go to TokenPost Telegram


