

XRP has risen by about 8% over the past 7 days. At the beginning of this week, the world's first XRP ETF was launched in Brazil. Despite the positive momentum, XRP remains trapped in a narrow trading range, with key resistance and support levels defining its short-term outlook.
Recent indicators, the RSI rebound, and the slightly bullish Ichimoku structure suggest cautious optimism.
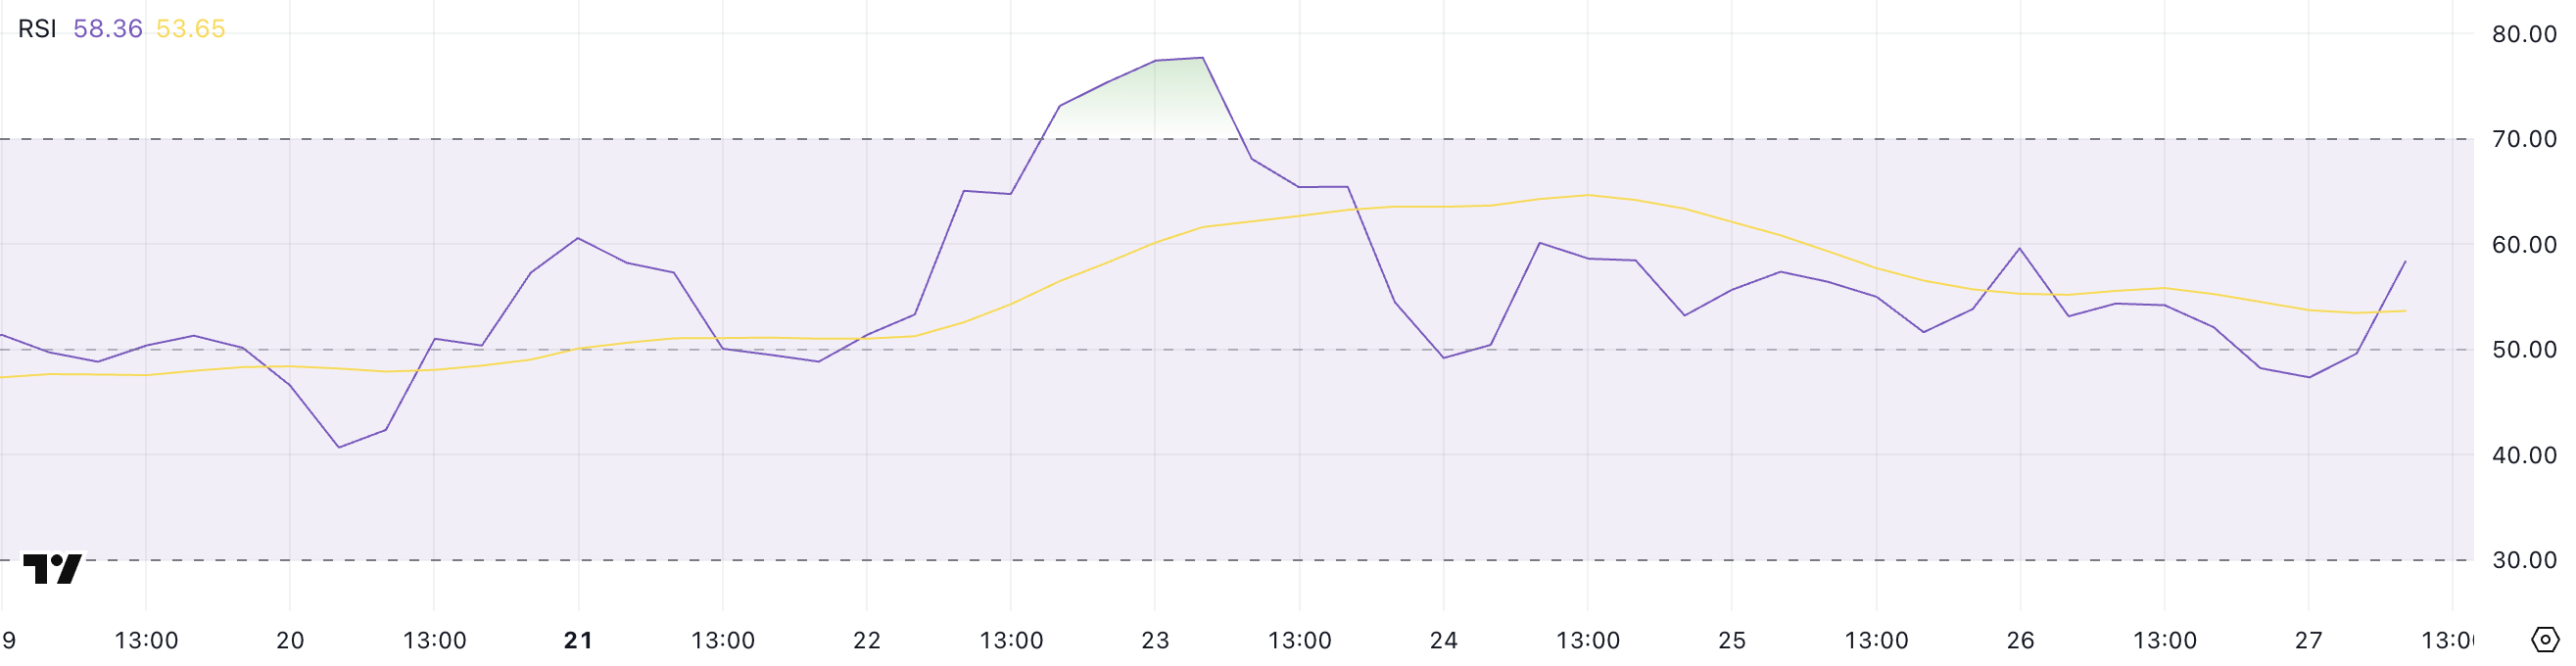
XRP RSI Rebound... What Does the Price Movement Mean?
XRP's Relative Strength Index (RSI) is currently at 58.36, rising from 47.34 this morning but still lower than the 77.7 reached four days ago.
This movement shows a recovery from recent low levels but is still below the overbought conditions seen earlier this week.
The recent RSI trend indicates a short-term momentum resurgence but suggests that XRP has not yet recovered the strong momentum it showed a few days ago, implying a more cautious sentiment among traders.
The RSI, or Relative Strength Index, is a momentum indicator that measures the speed and change of price movements on a scale from 0 to 100.
Generally, an RSI above 70 indicates an asset is overbought and may need a correction, while below 30 suggests an oversold condition with potential for a rebound.
With XRP's RSI currently at 58.36, the asset shows a neutral to slightly bullish trend, suggesting room for further increase without immediately triggering overbought conditions.
If buying pressure continues, it could set the stage for a gradual upward movement, but the lack of strong momentum could also lead to range-bound trading.
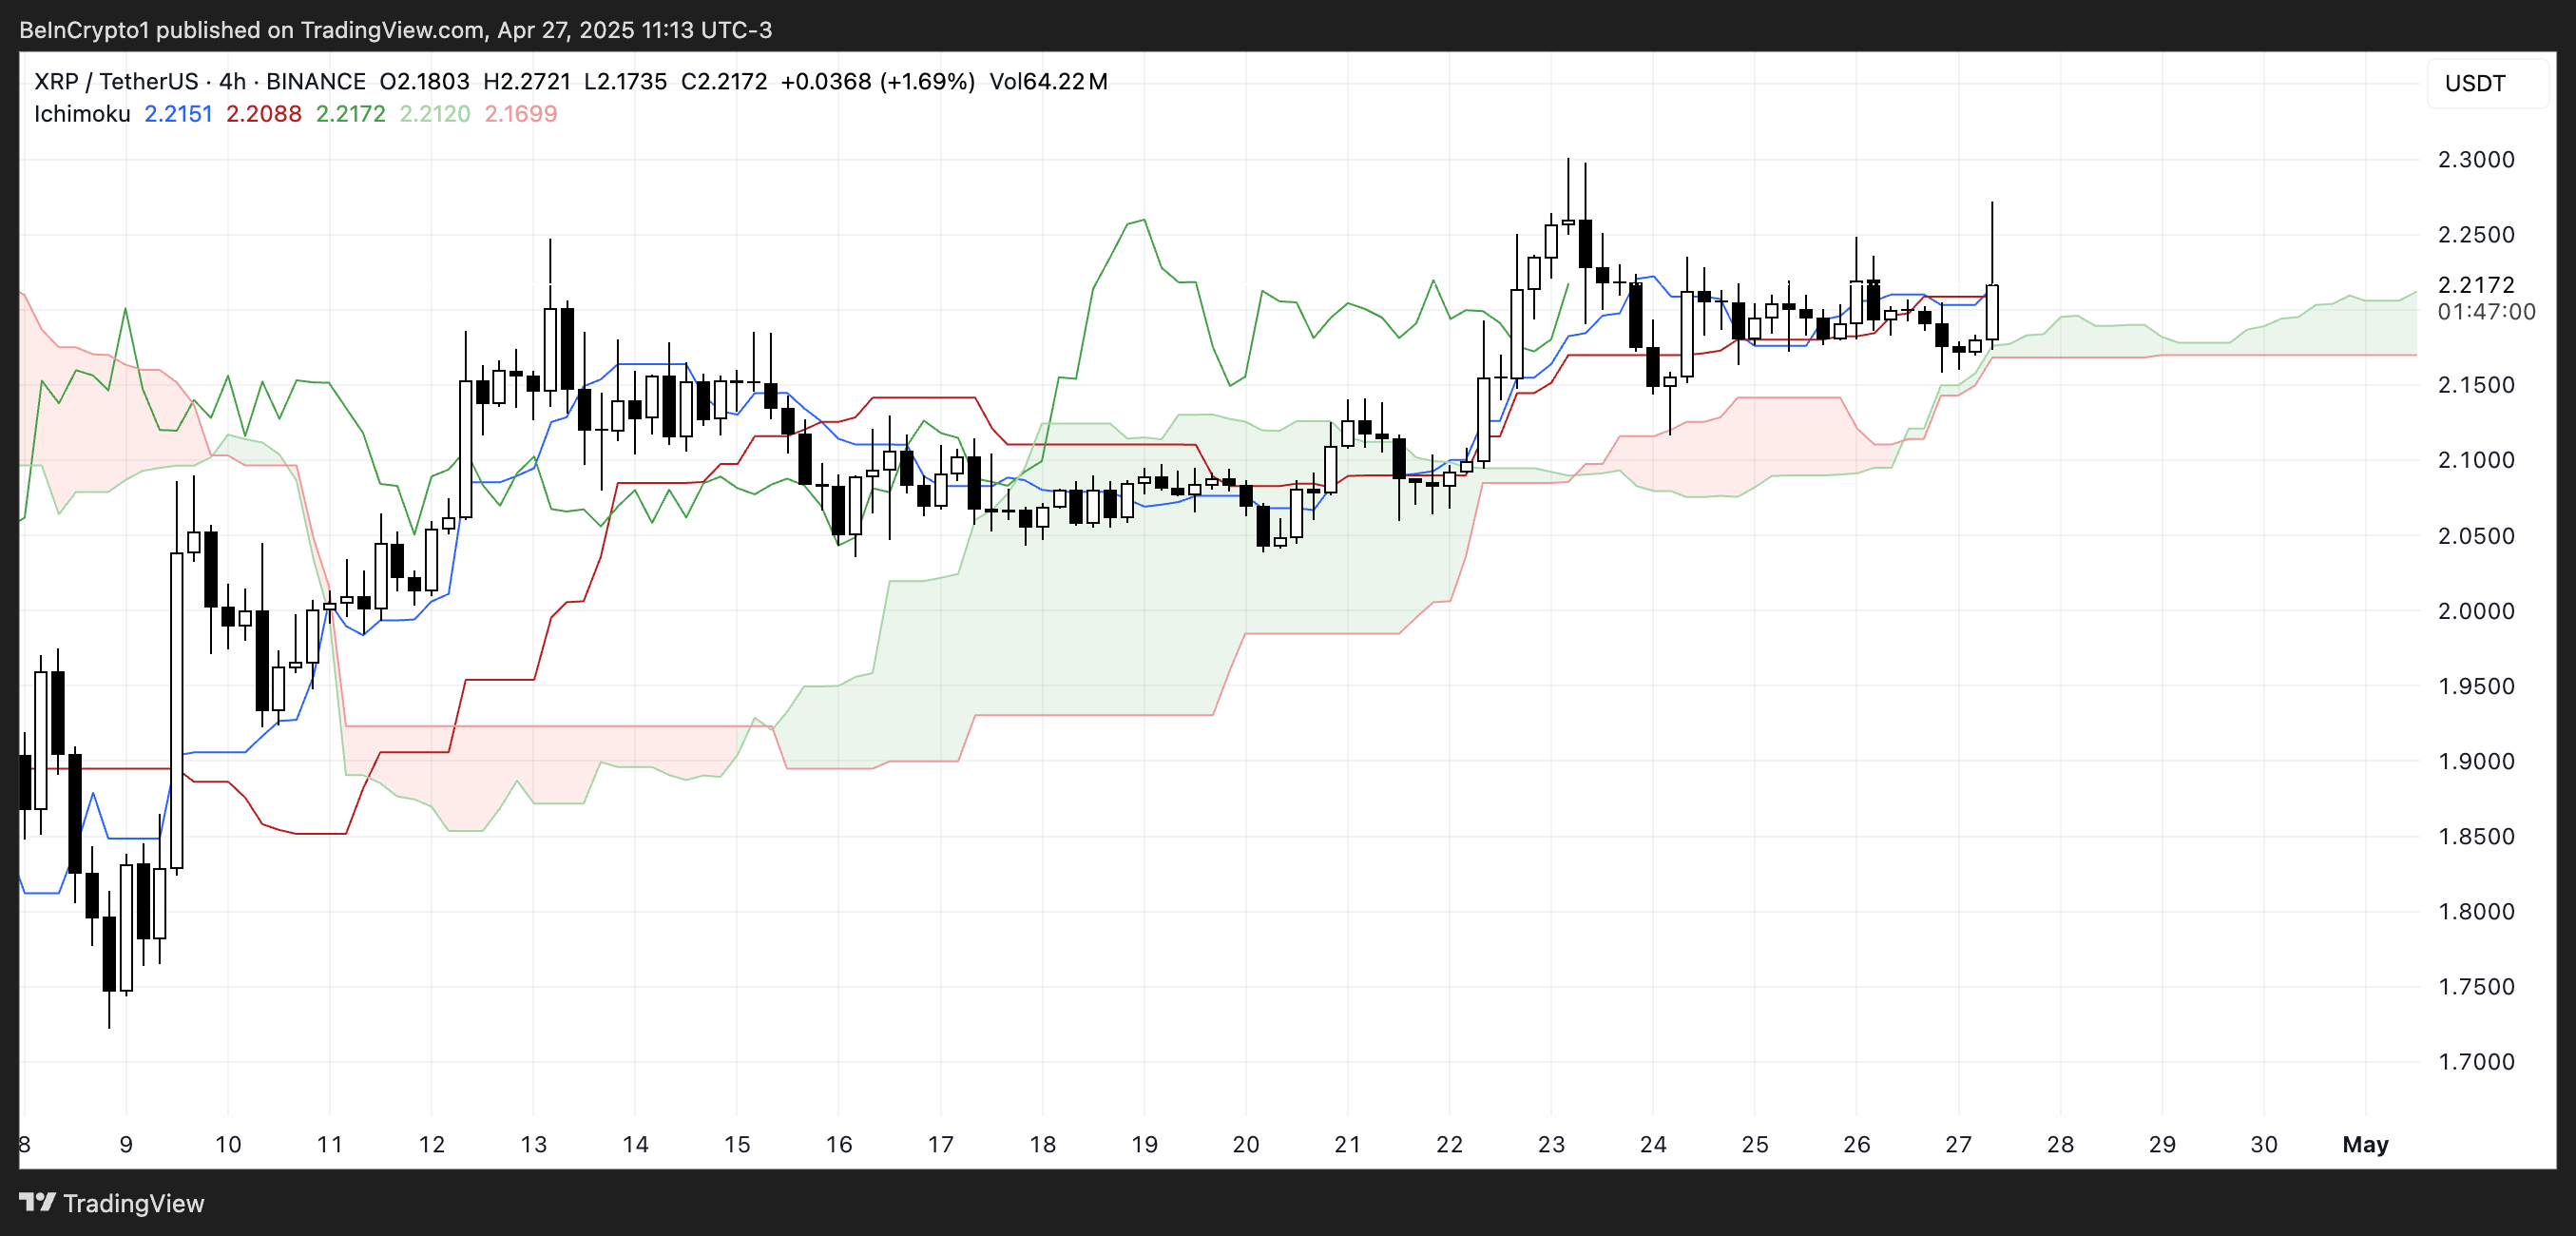
XRP Price Stagnating Above the Ichimoku Cloud
XRP's Ichimoku chart shows a price structure located just above the cloud.
The blue (conversion line) and red (base line) lines are positioned close to the current candle, reflecting a slightly bullish market but without strong momentum.
The future cloud remains green, still indicating expected upward conditions. However, the lines close to the price suggest some short-term hesitation or correction.
The Ichimoku system fully captures trend direction, momentum, and support/resistance areas.
When the price is above the cloud with a green cloud ahead, it typically indicates a favorable trend. However, when the conversion and base lines are close to the price, it may indicate a lack of clear conviction for both buyers and sellers.
For XRP, the upward trend is still maintained, but the close positioning of the lines suggests a vulnerable uptrend that could easily change direction.
XRP Outlook: Who Will Lead - Bulls or Bears?
XRP price is trading in a narrow range between the resistance level of $2.30 and the support level of $2.11.
This sideways movement occurred two days after the world's first XRP ETF was launched in Brazil, which could ultimately influence market sentiment.
If XRP declines and loses the $2.11 support level, it could lead to a drop to the next support level at $2.04.
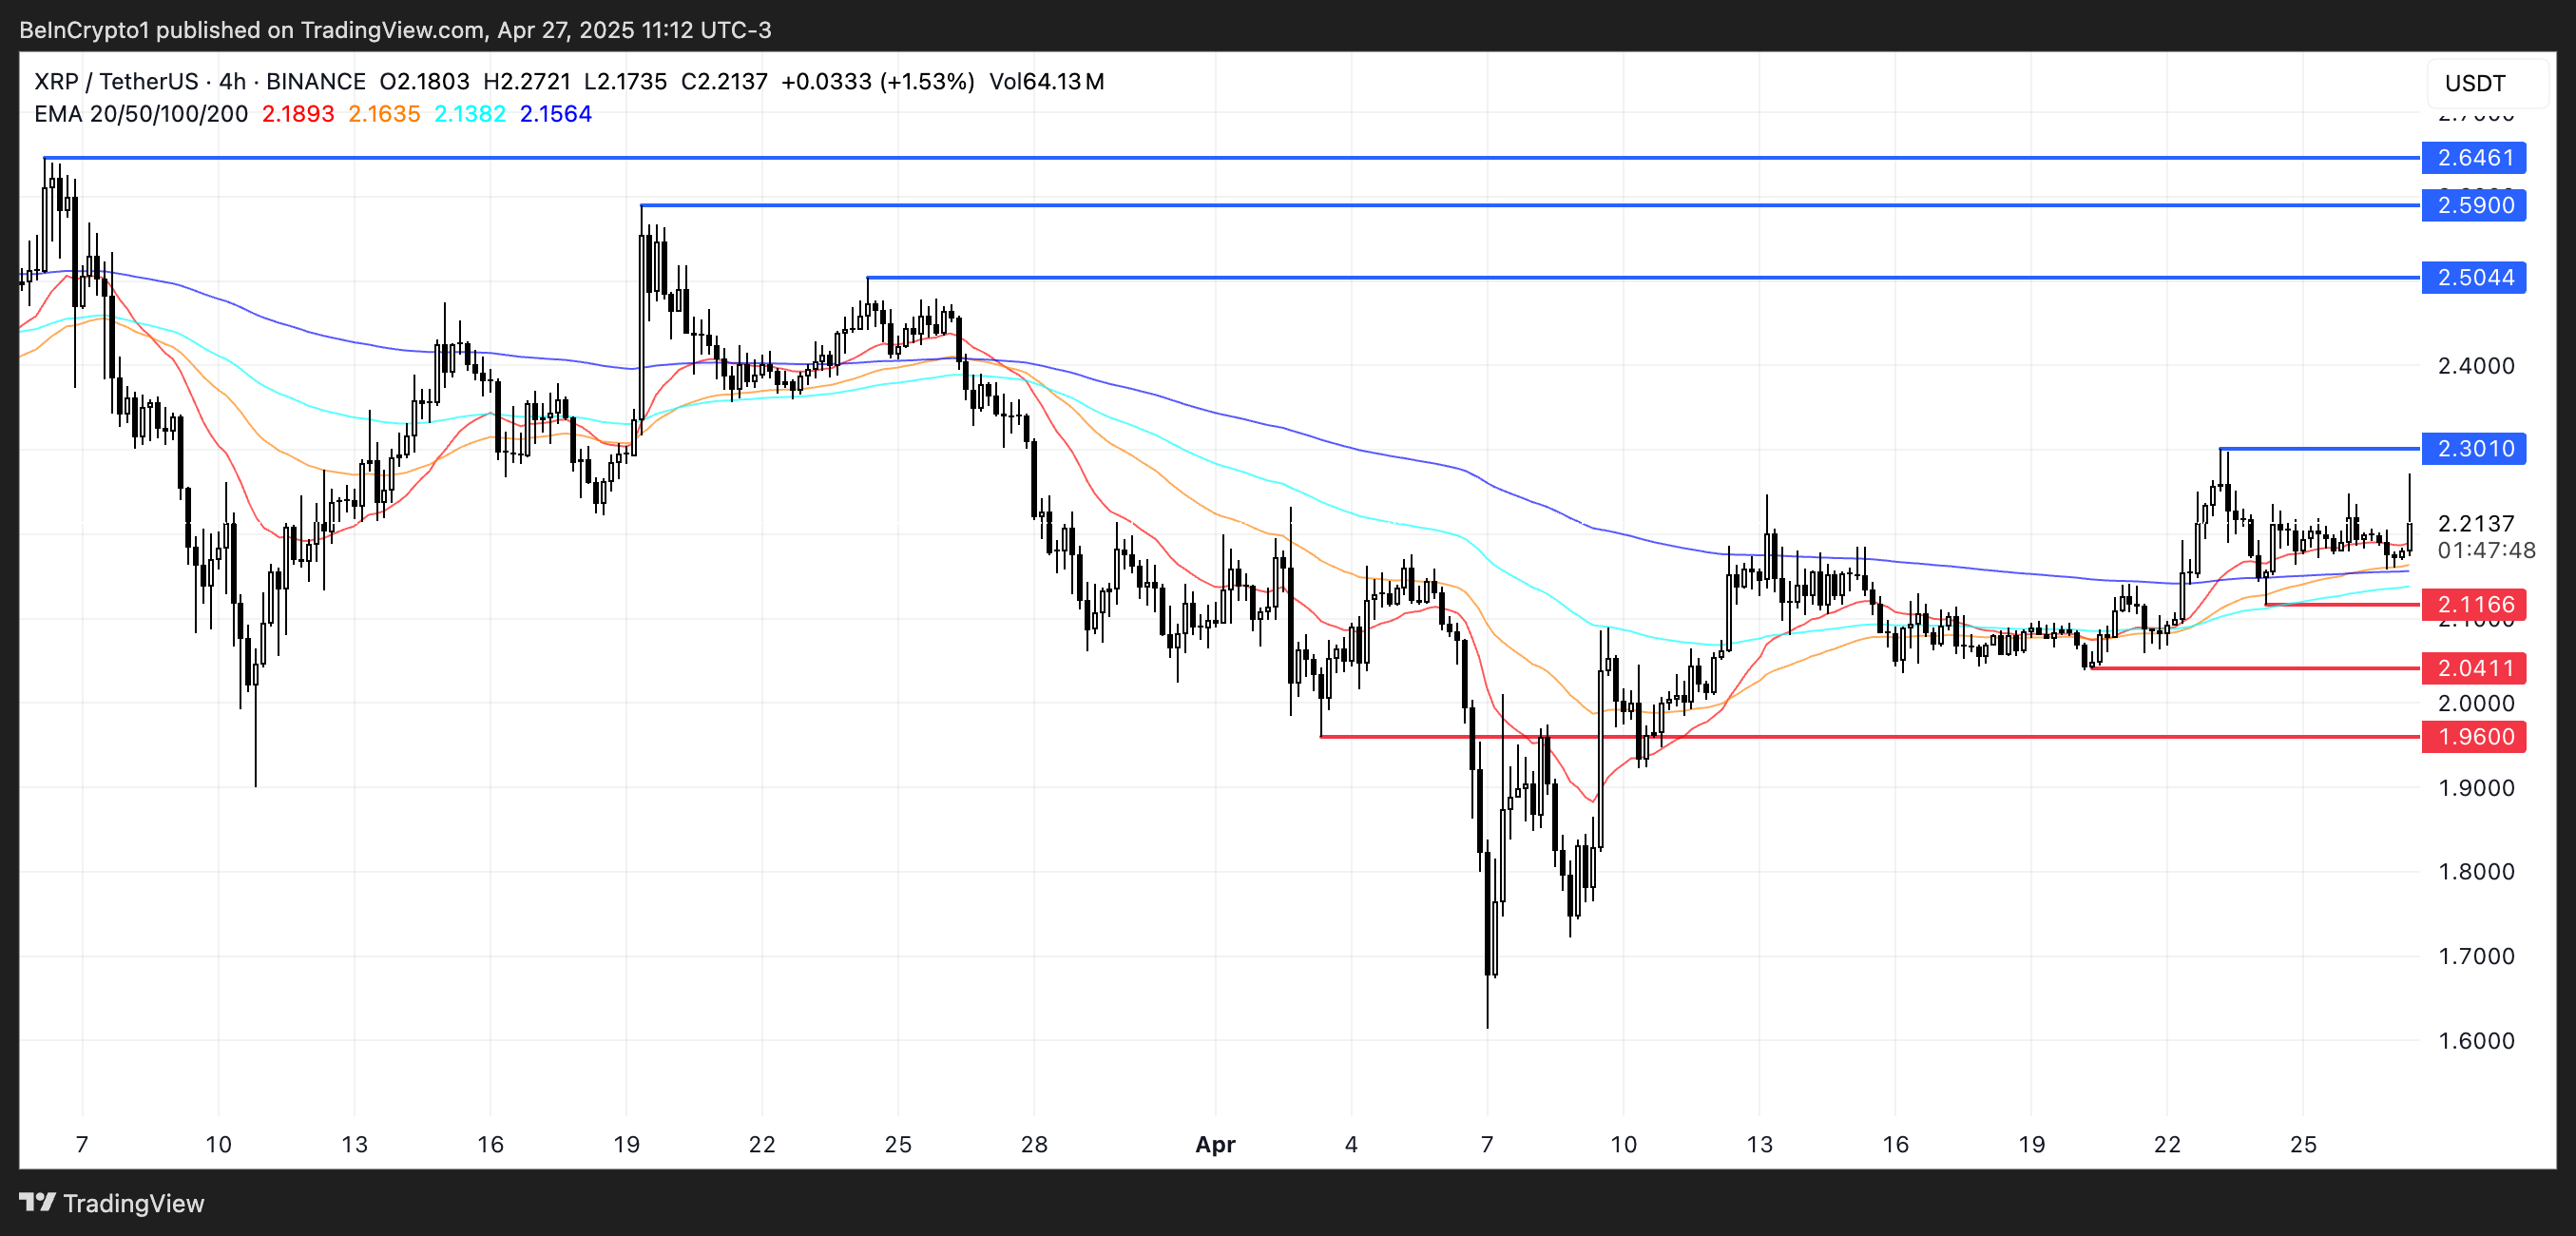
If the downtrend intensifies, XRP could test the lower level of $1.96, and defending the current support zone is crucial for buyers.
Conversely, if XRP tests and breaks through the $2.30 resistance with strong upward momentum, the next upward target would be around $2.50.
Sustained strength could push the price to $2.59, and if buyers maintain control, it could extend to $2.64.


