

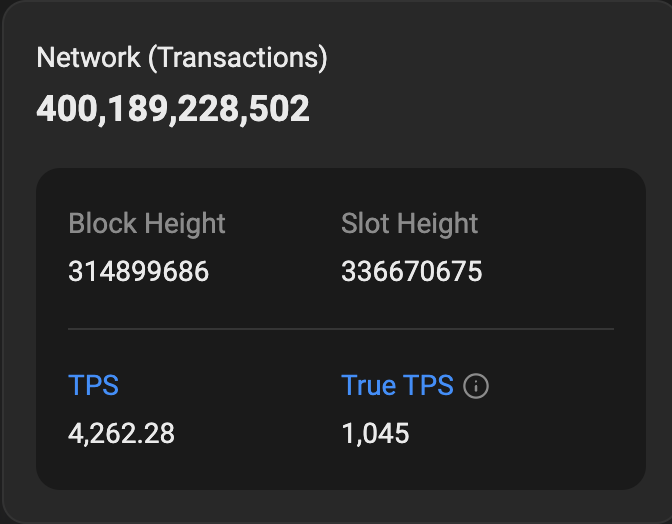
Solana (SOL) has recently crossed $150 and passed an important milestone of 40 billion total transactions.
On-chain activity remains strong, but momentum indicators such as RSI and narrowing exponential moving average (EMA) intervals suggest that the upward trend is beginning to cool. SOL is currently trading near an important support level of $145.59, with both downside risks and upside opportunities present.
Solana Network Surpasses 40 Billion Transactions
Solana has passed an important milestone, exceeding 40 billion total transactions. This achievement came at a time when SOL's momentum was being newly reinforced, with the price recently crossing $150 for the first time since early March, though experiencing a slight correction.
On-chain activity remains robust, with decentralized exchange (DEX) trading volume surging to $21 billion over the past 7 days. This represents a 44% increase, firmly placing Solana at the forefront.
Since hitting a low of $9.98 on January 1, 2023, SOL has recorded an impressive 1,412% increase, standing out as one of the cycle's top performances.
Solana has experienced an ecosystem explosion over the past year. The pump generated over $75 million in fees last month alone, and major protocols like Radium, Meteora, Jupiter, and Zito continue to generate millions of dollars in revenue monthly.
SOL Momentum Slowing... RSI Plummets
Solana's Relative Strength Index (RSI) has rapidly cooled, dropping from 70.52 to 50.61 four days ago.
This sharp decline reflects the slowdown in SOL's price momentum after rising above $150, suggesting the upward trend is losing strength.
RSI is a widely used momentum indicator that measures how quickly and strongly prices move over a certain period. Levels above 70 indicate overbought conditions, while below 30 indicate oversold conditions. Levels near 50 reflect a more balanced, neutral stance between buying and selling forces.
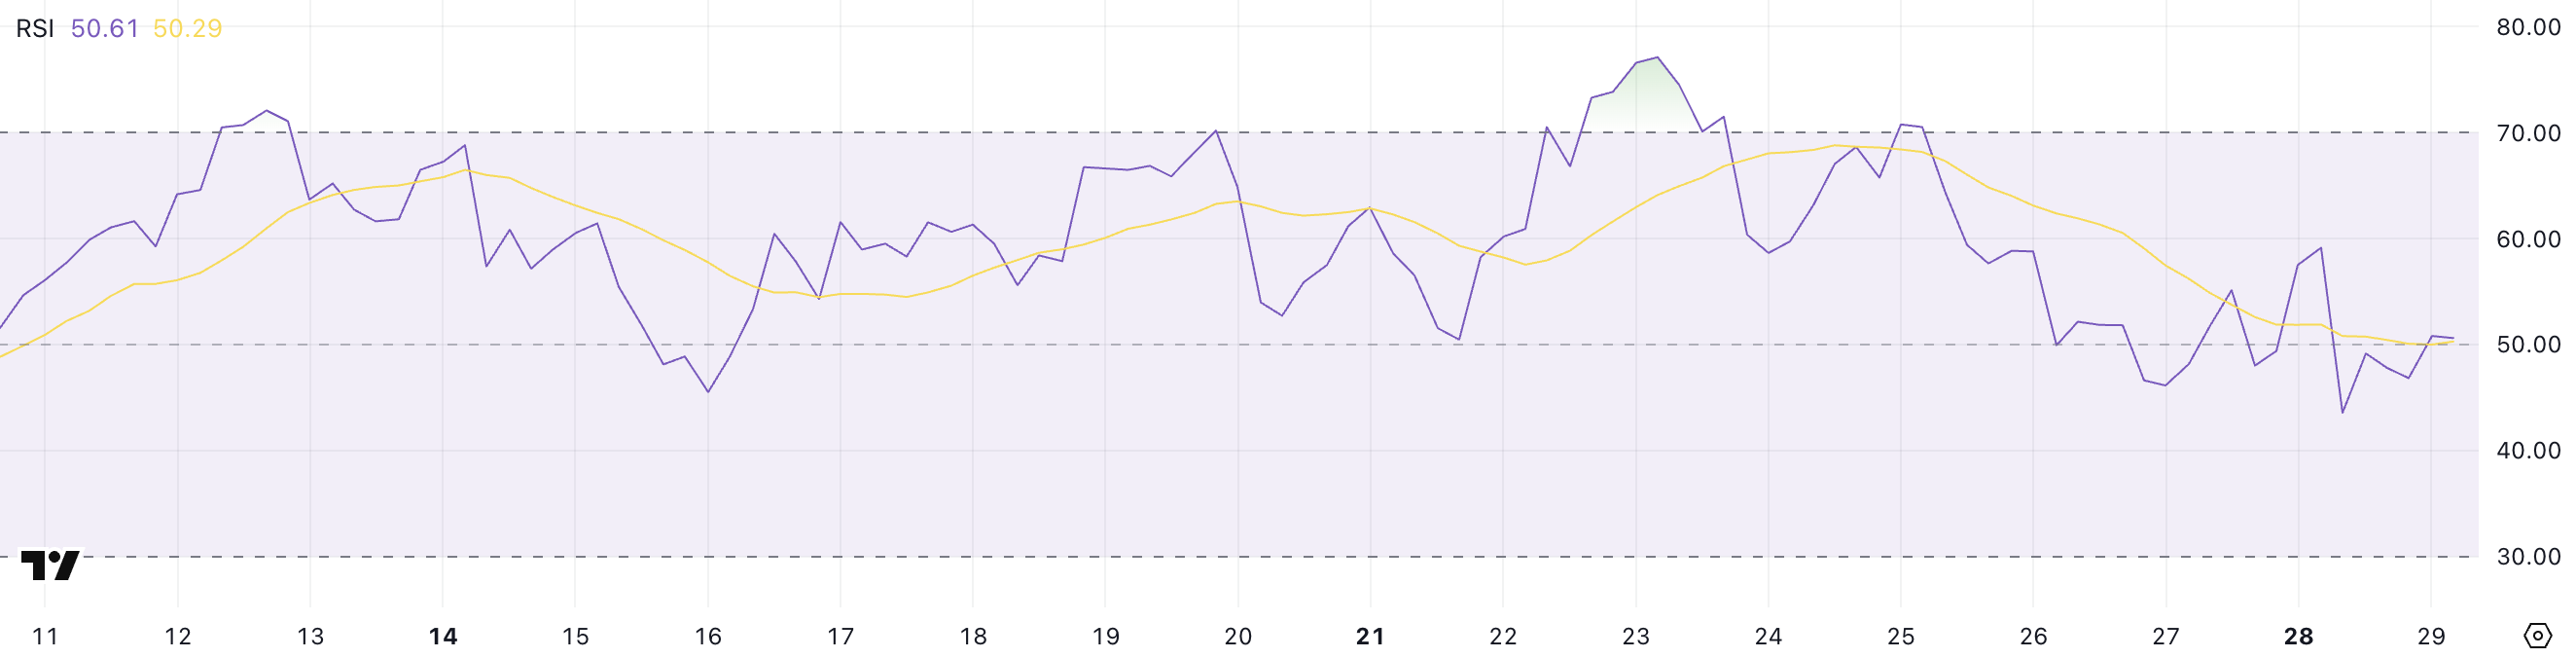
The market stands at a critical juncture with Solana's RSI currently hovering near 50.
If buying pressure increases again, the RSI could rise back to overbought levels, potentially paving the way for another rally. Conversely, if the downtrend continues, it could confirm momentum weakening and open the door to broader price corrections.
SOL's momentum has certainly cooled, and traders are watching closely for the next decisive move.
SOL Strength Setup Test... Support or Breakout?
Solana's exponential moving averages (EMA) still indicate an upward trend, with short-term averages above long-term averages. However, the interval has narrowed compared to a few days ago, reflecting momentum loss.
Solana's price is currently hovering near an important support level of $145.59, an area closely monitored by traders.
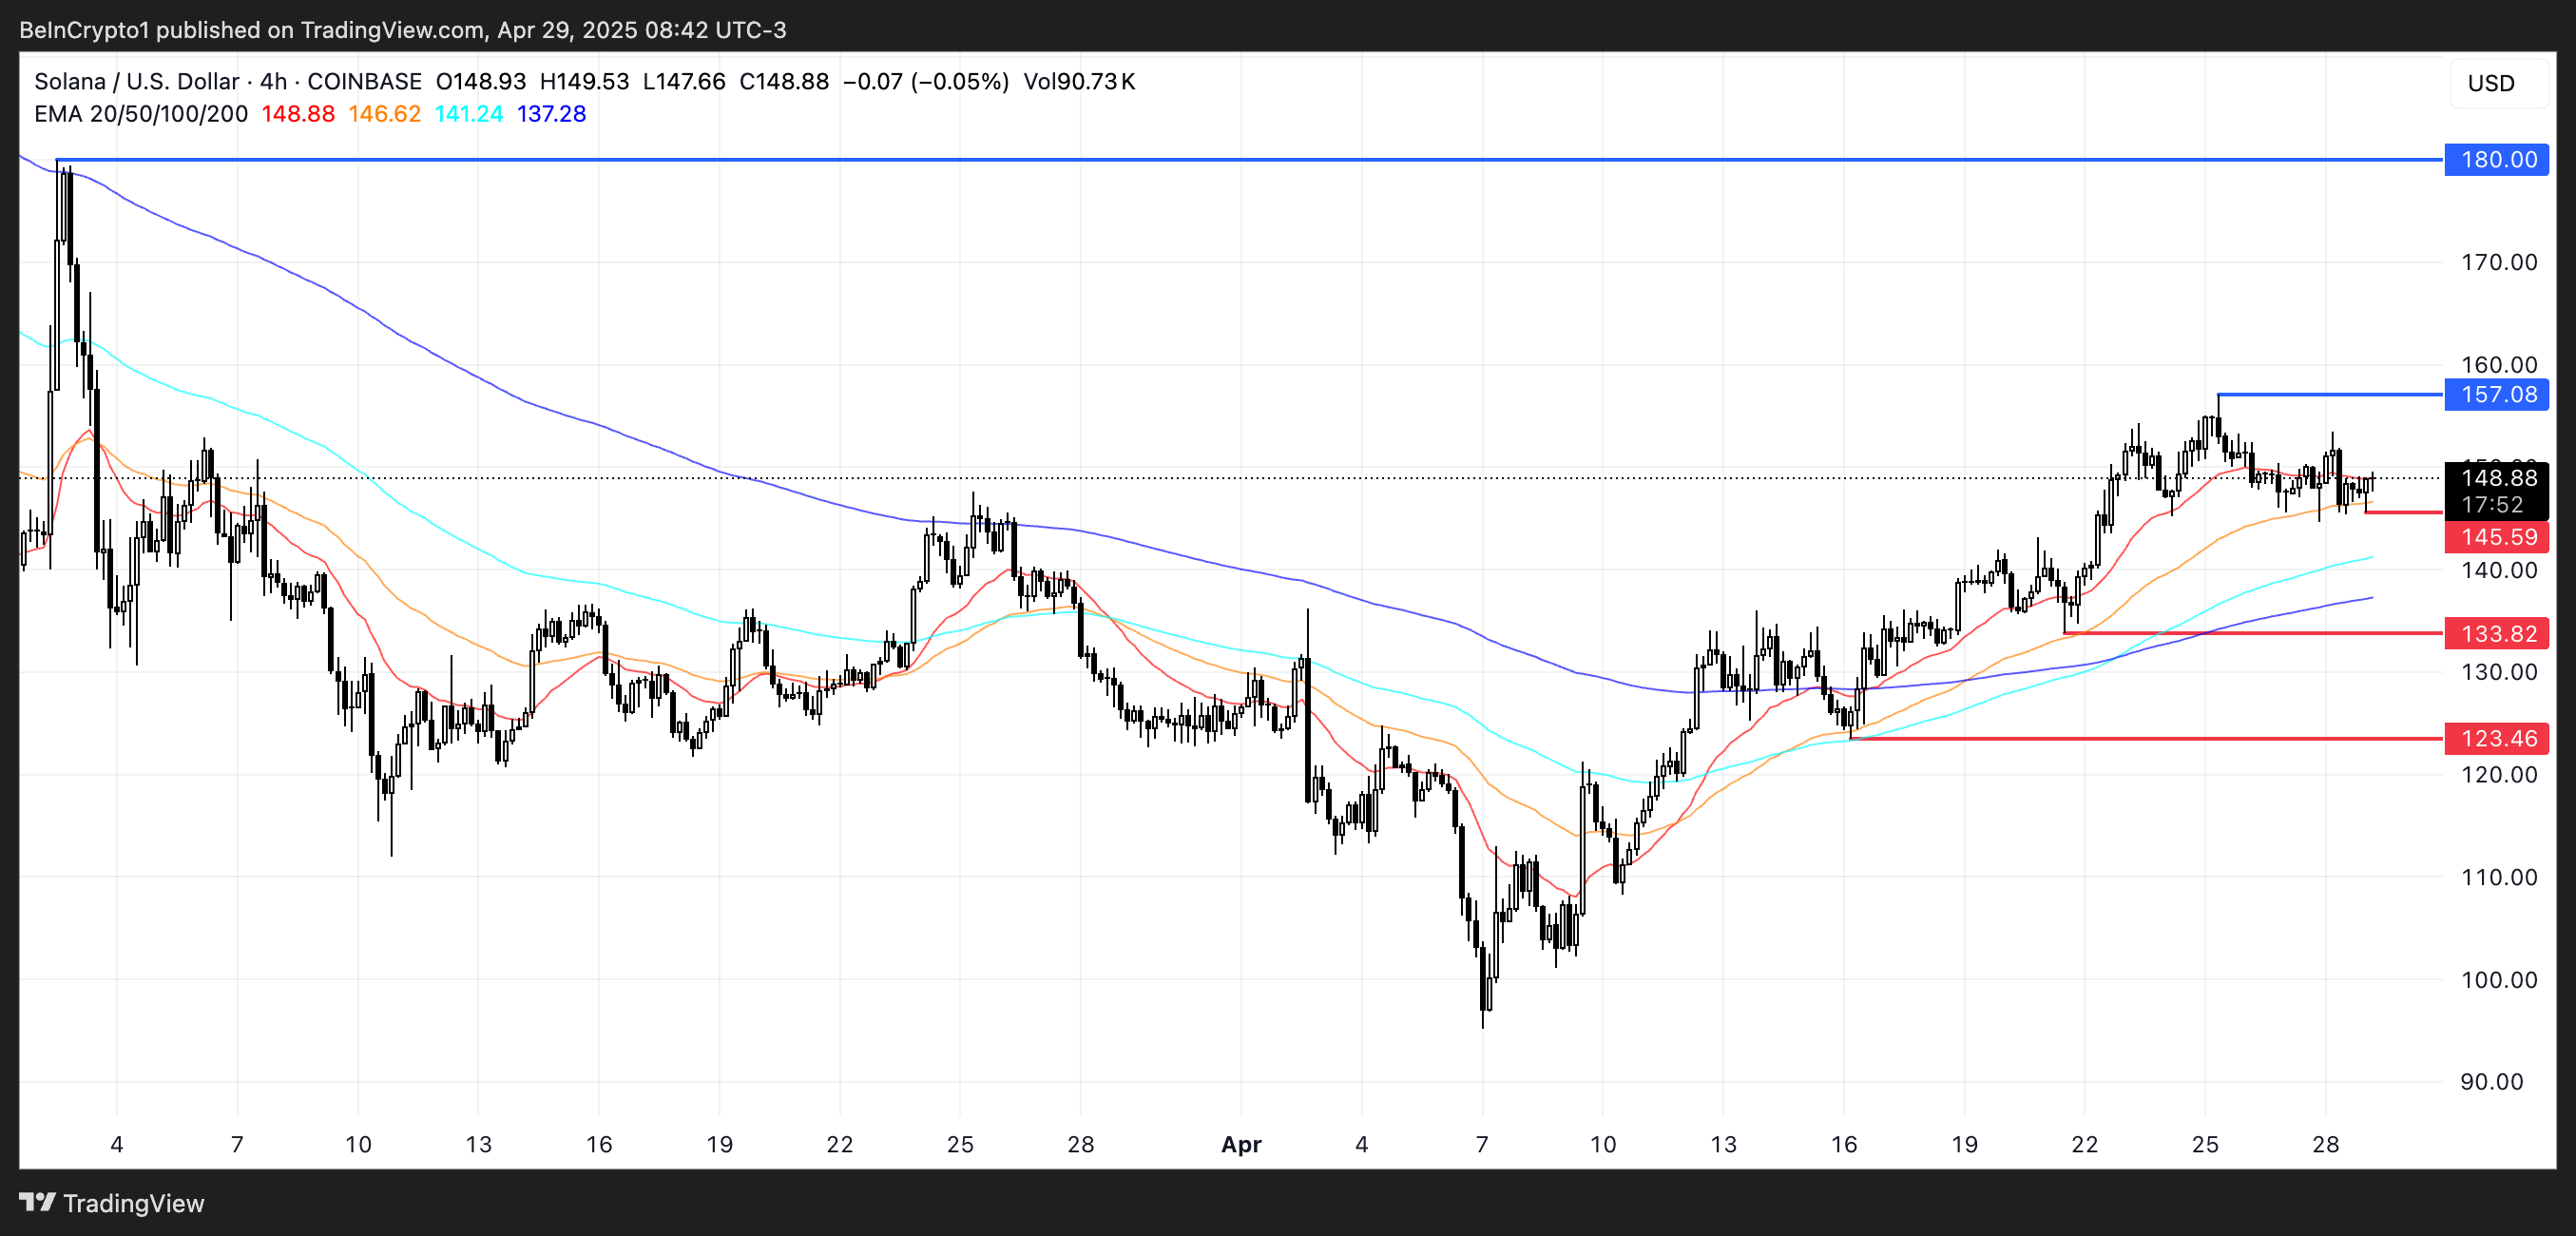
If this support level breaks, the price could drop to $133.82, and with increased selling pressure, could move even deeper to $123.46.
Conversely, if buyers regain the momentum seen earlier this month, Solana could rebound and retest resistance near $157.
Clearly breaking that zone could likely trigger a rise to $180, reviving the upward trend.


