

Ethereum (ETH) has risen by more than 10% over the past 7 days. The market shows signs of resumed activity. However, key technical indicators reveal weakened trend strength and cautious optimism among buyers.
ETH is currently fighting a critical resistance zone that could determine the continuation of its rally. With momentum still weak, May could be a decisive month for Ethereum's next major movement.
Ethereum Trend Rapidly Weakening... Bear Forces Approaching
Ethereum's DMI chart shows ADX has sharply dropped from 39 to 24.91 currently. ADX, or Average Directional Index, measures trend strength.
Generally, an ADX above 25 indicates a strong trend, while below 20 suggests the market is entering a weak or range-bound trading phase.
The ADX's sharp decline indicates Ethereum's recent momentum is quickly weakening. Without new buying or selling pressure, ETH may be trapped in a more volatile sideways pattern in the short term.
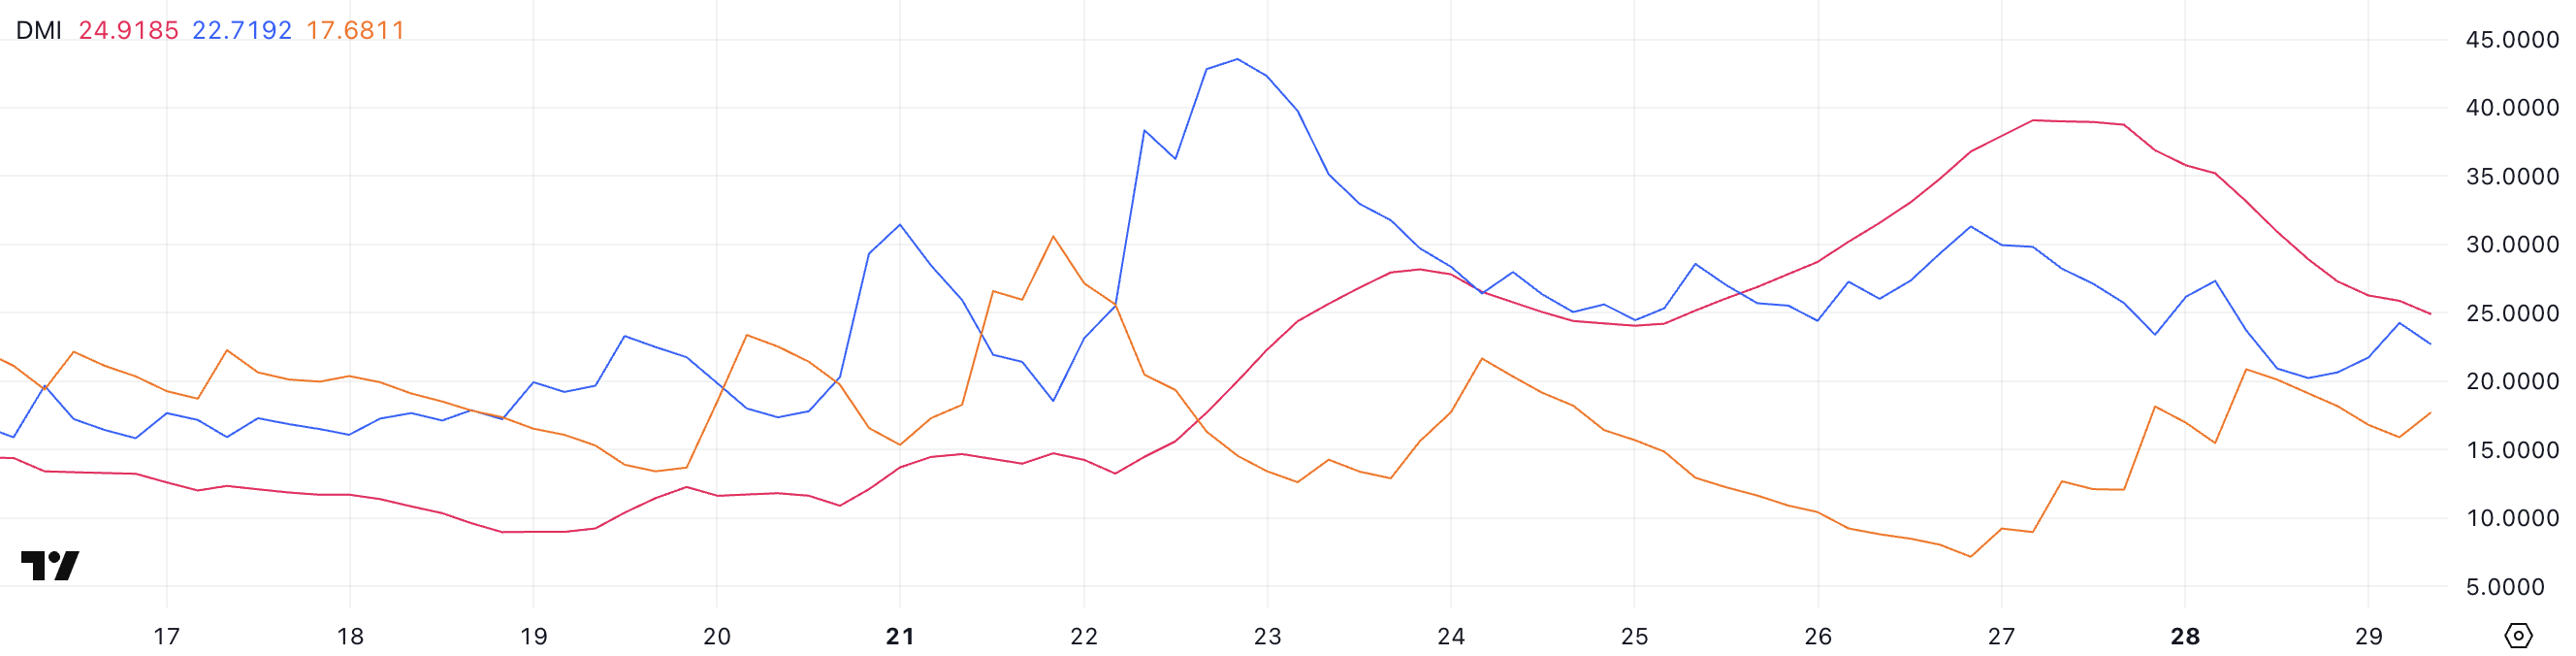
Meanwhile, the directional indicator shows clear changes. The +DI tracking bullish pressure has fallen to 22.71, dropping from 31.71 three days ago to 27.3 yesterday.
In contrast, the -DI tracking bearish pressure rose to 17.68, increasing from 7.16 three days ago to 15.64 yesterday. Yesterday, with +DI at 20.91 and -DI at 20.1, the gap between buyers and sellers nearly closed, suggesting sellers almost regained market control.
This increase in bearish momentum and weakened trend strength raises the risk of Ethereum's price declining if buyers fail to defend key levels. However, if buyers maintain support and regain momentum, ETH can still attempt a recovery.
ETH RSI Surges Then Drops... Will Recovery Continue?
Ethereum's RSI is currently at 56, rising from 45.5 a day ago. It reached 70.46 four days ago. The Relative Strength Index (RSI) measures the speed and magnitude of price movements.
Generally, an RSI above 70 indicates an asset is overbought and may need correction, while below 30 suggests an oversold condition and potential rebound.
Readings between 30 and 70 are considered neutral, with levels near 50 indicating the market is at a decision point. Ethereum's RSI's recent sharp fluctuations reflect the recent volatile sentiment towards ETH.
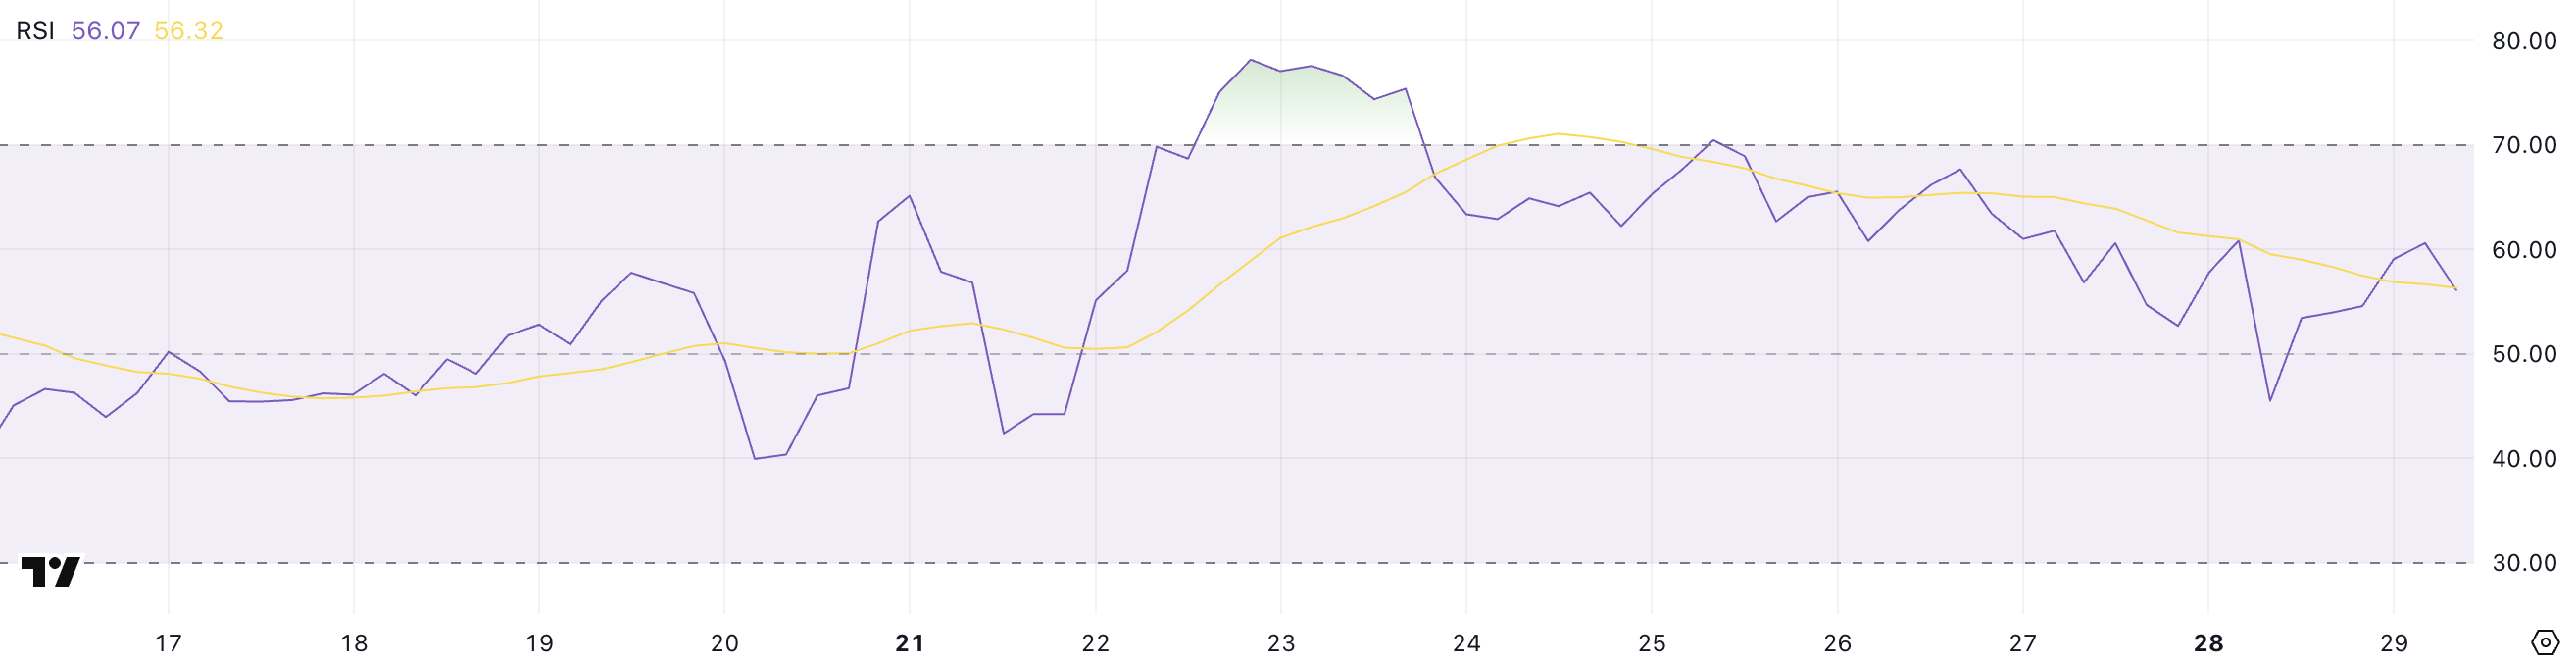
With RSI rising to 56, Ethereum has regained momentum after falling from neutral to bearish territory. A reading above 50 indicates slight bullishness, suggesting buyers have somewhat regained control, though not with overwhelming strength.
If RSI continues rising above 60, it could signal a new upward push in ETH price.
However, if momentum stalls and RSI drops, it may suggest the recovery is losing steam and Ethereum could return to a broader correction phase.
Ethereum: Will It Break Key Resistance?
Ethereum's price has made several attempts to break the $1,828 resistance level in recent days. If ETH can definitively break and maintain this level, it could open doors to a stronger upward movement.
The next major target is $1,954, and with strong bullish momentum, an additional rally to $2,104 could unfold. Ethereum could test $2,320 in a more aggressive uptrend, indicating significant bullish expansion.
These levels will be crucial to watch, potentially defining the strength and sustainability of any breakout in the coming days.
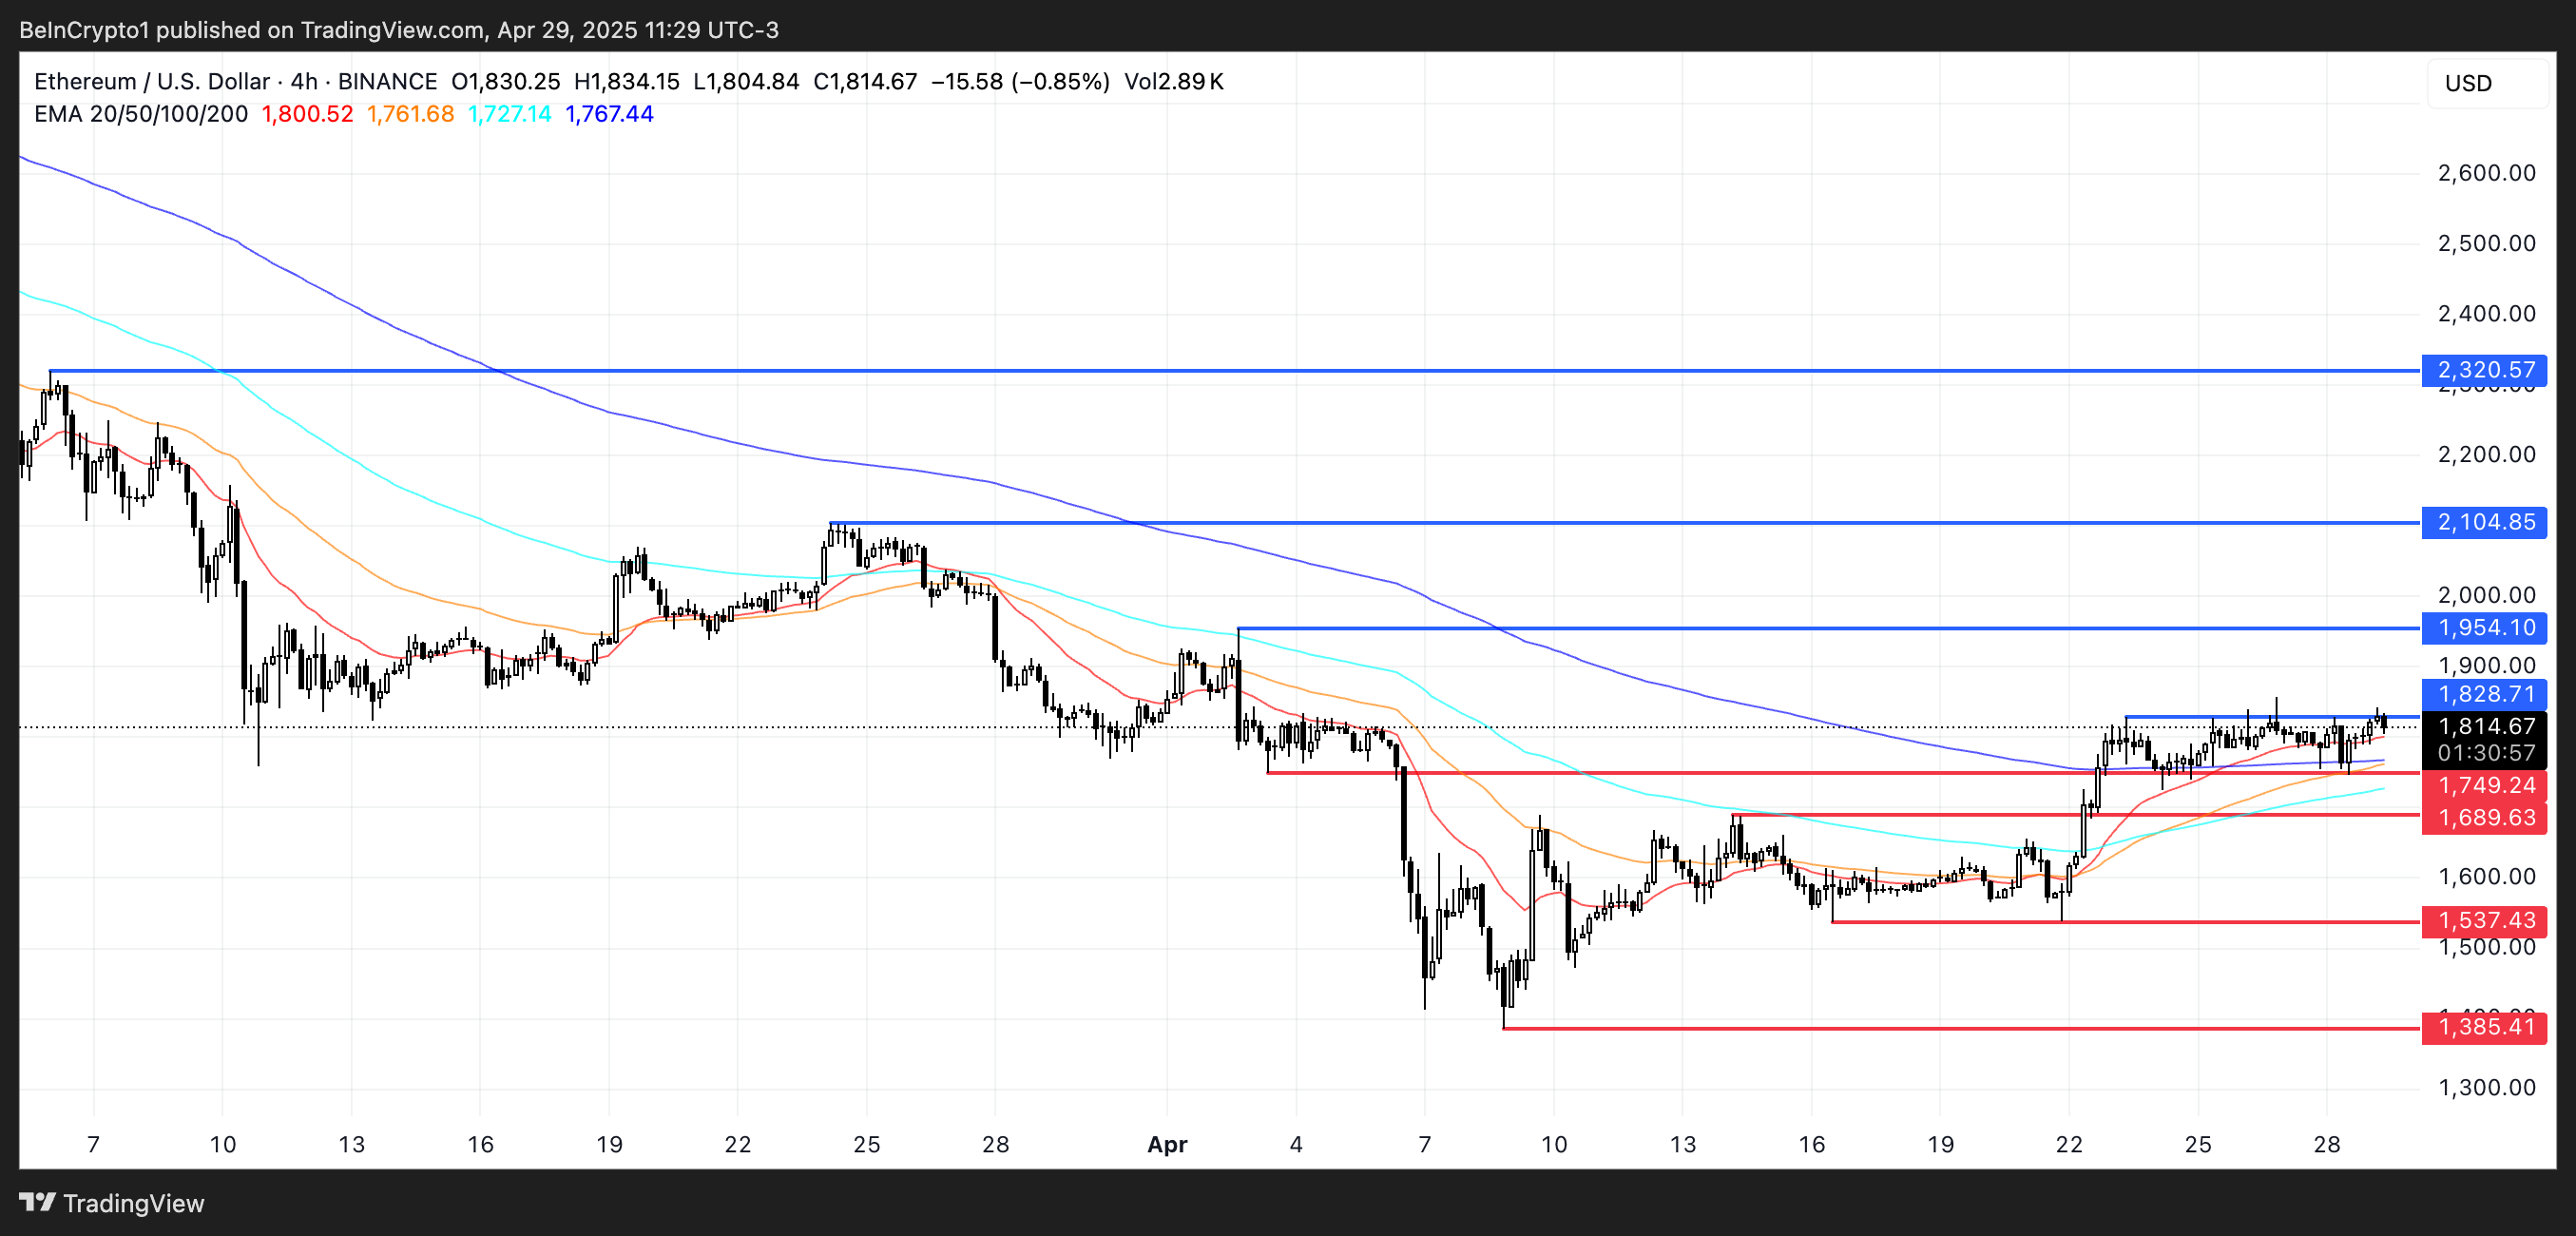
On the downside, if Ethereum fails to maintain current levels and the trend reverses, the first critical support is at $1,749. Falling below this could trigger a drop to $1,689.
If selling pressure intensifies, ETH could extend its decline, with key support levels at $1,537 and $1,385 potentially coming into play.
Losing these levels could initiate a deeper correction. The recent recovery attempt may have been temporary before a longer downward phase.

