

In May 2025, Bit price broke through $111,000, creating a historic high, like a dazzling meteor crossing the financial night sky. Global investors held their breath, trying to decipher the end of this surge: will it continue soaring or decline at its peak? CryptoQuant analyst Axel Adler Jr. predicts that Bit might reach a pressure point of $162,000 on June 11th, igniting market expectations for the next target. However, policy turbulence, inflation concerns, and market fragmentation are casting shadows on this celebration.
From PlanB's Stock-to-Flow (S2F) model to power law model, and the ahr999 hoarding indicator to multi-dimensional technical analysis, investors are armed with various tools, attempting to find direction in this price fog. This article will analyze whether Bit has reached its peak based on the latest market dynamics, exploring its short-term correction risks and long-term potential. We believe Bit has not yet peaked, with $162,000 potentially being the next key node, but short-term volatility risks cannot be underestimated, and investors need to find balance between enthusiasm and rationality.
Belief in Scarcity: Long-term Narrative of S2F and S2FX
...Specifically, the RSI calculation formula is: RSI = 100 - [100 / (1 + RS)], where RS is the average increase divided by the average decrease. The current RSI reflects the strong rebound from $106,000 to $110,000, but on May 25th, Coindesk analyst Aoyon Ashraf pointed out that low retail participation and low funding rates limit the risk of overheating. In the short term, if RSI continues to rise above 75, or accompanied by external shocks (such as the PCE data on May 30th exceeding expectations), the probability of a pullback will significantly increase. Investors can pay attention to whether RSI falls back to the balanced range of 60-65 as a buy signal.
200-Week Moving Average Heatmap: A Stable Anchor of Cycle Patterns
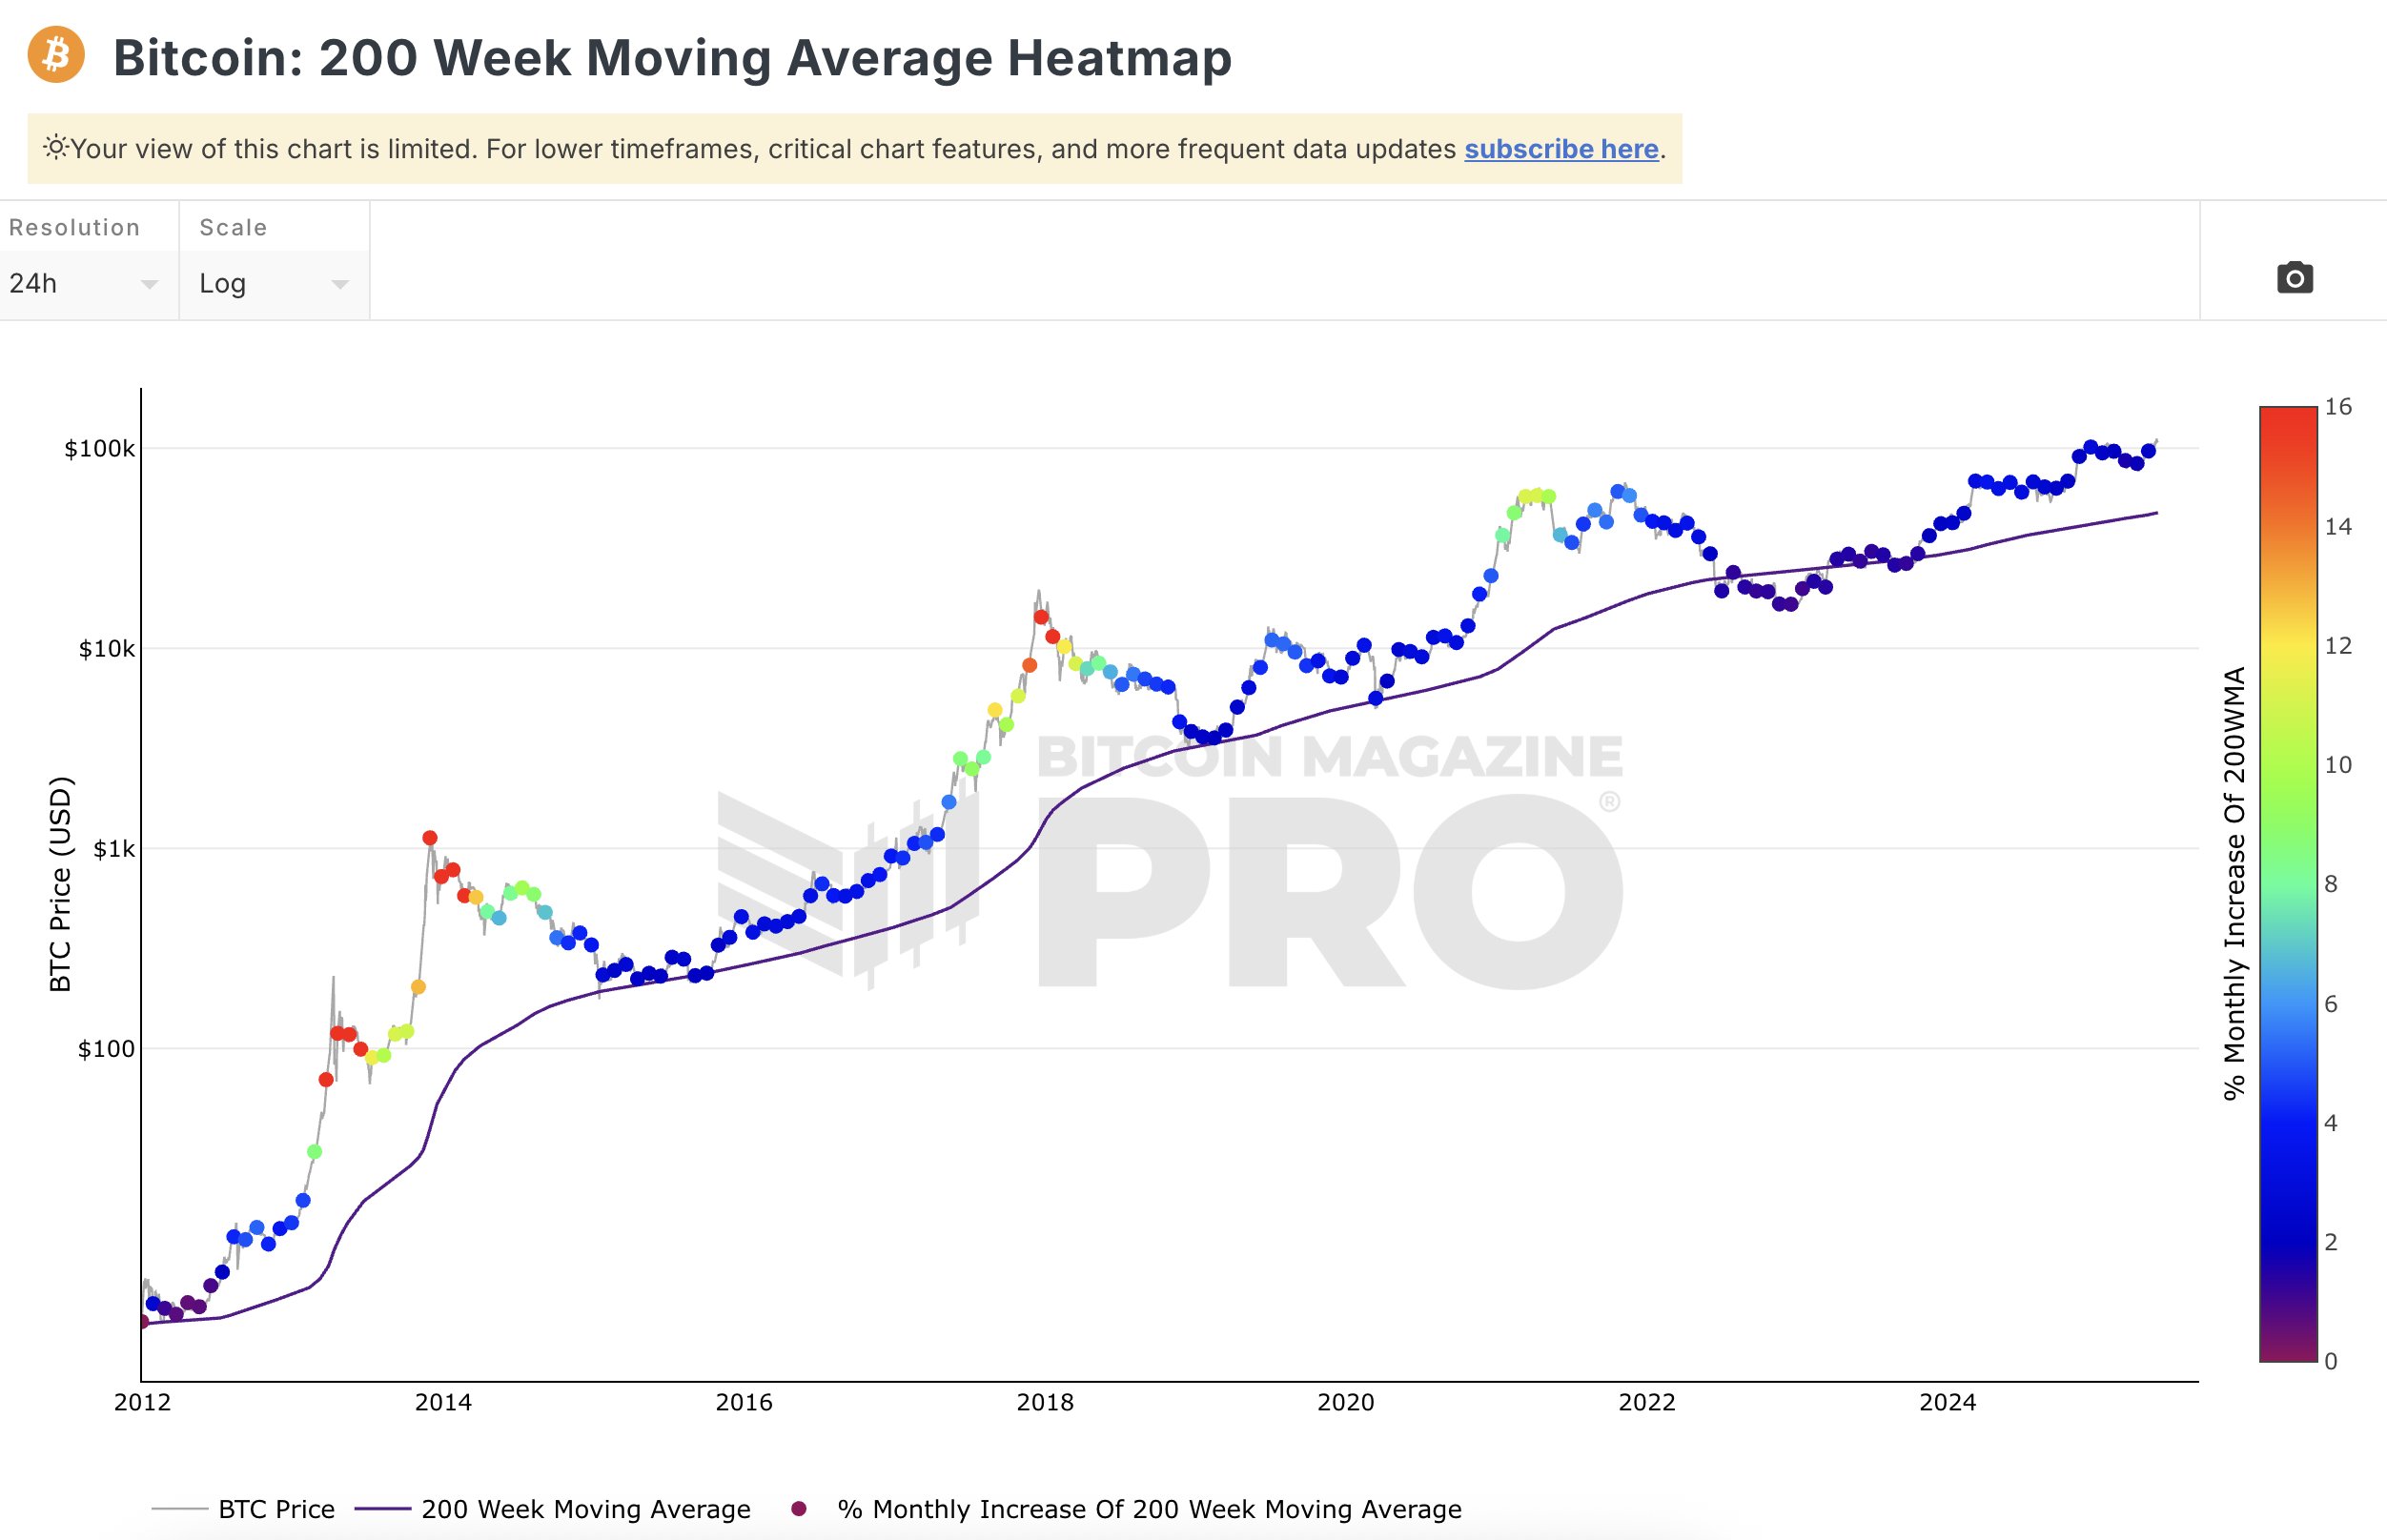
The 200-Week Moving Average (200WMA) Heatmap is a powerful tool for Bit cycle analysis, revealing the deviation of prices from the long-term trend through the 200-week (about 3.8 years) price moving average, combined with color coding (blue for undervalued, red for overvalued). The 200-week moving average is often viewed as the "ultimate support line" for Bit, which has never been broken historically, representing the cost basis of long-term holders. The heatmap quantifies market temperature through the distance between price and the moving average.
Currently, Bit price is at $109,300, with the 200-week moving average around $45,000, and the heatmap shows a blue "buy" or "hold" area, far from entering the orange or red overvalued zone. Historical data shows that during the bull market peaks in 2017 and 2021, the heatmap turned deep red, with prices reaching $20,000 and $69,000 respectively, far exceeding the 200-week moving average (around $3,000 and $20,000 at the time). The current blue signal on the heatmap, combined with institution-led market trends (such as ETF net inflows), indicates that the market has not reached its peak, and holding or adding positions remains attractive.
The unique value of the heatmap lies in its stability of long-term trends. Even during the 2022 bear market when prices fell to $16,000, the 200-week moving average still provided support, and the heatmap remained green, signaling a rebound. In the short term, the heatmap responds slowly to rapid fluctuations and needs to be paired with indicators like RSI. For example, QCP Capital noted that European port congestion might drive up inflation, affecting the May 30th PCE data, which could cause a market risk aversion and potentially lead to a brief price pullback, but the blue signal of the heatmap suggests that the long-term trend remains unchanged.
Two-Year Moving Average Multiplier: A Precise Ruler of Bull Market Peaks
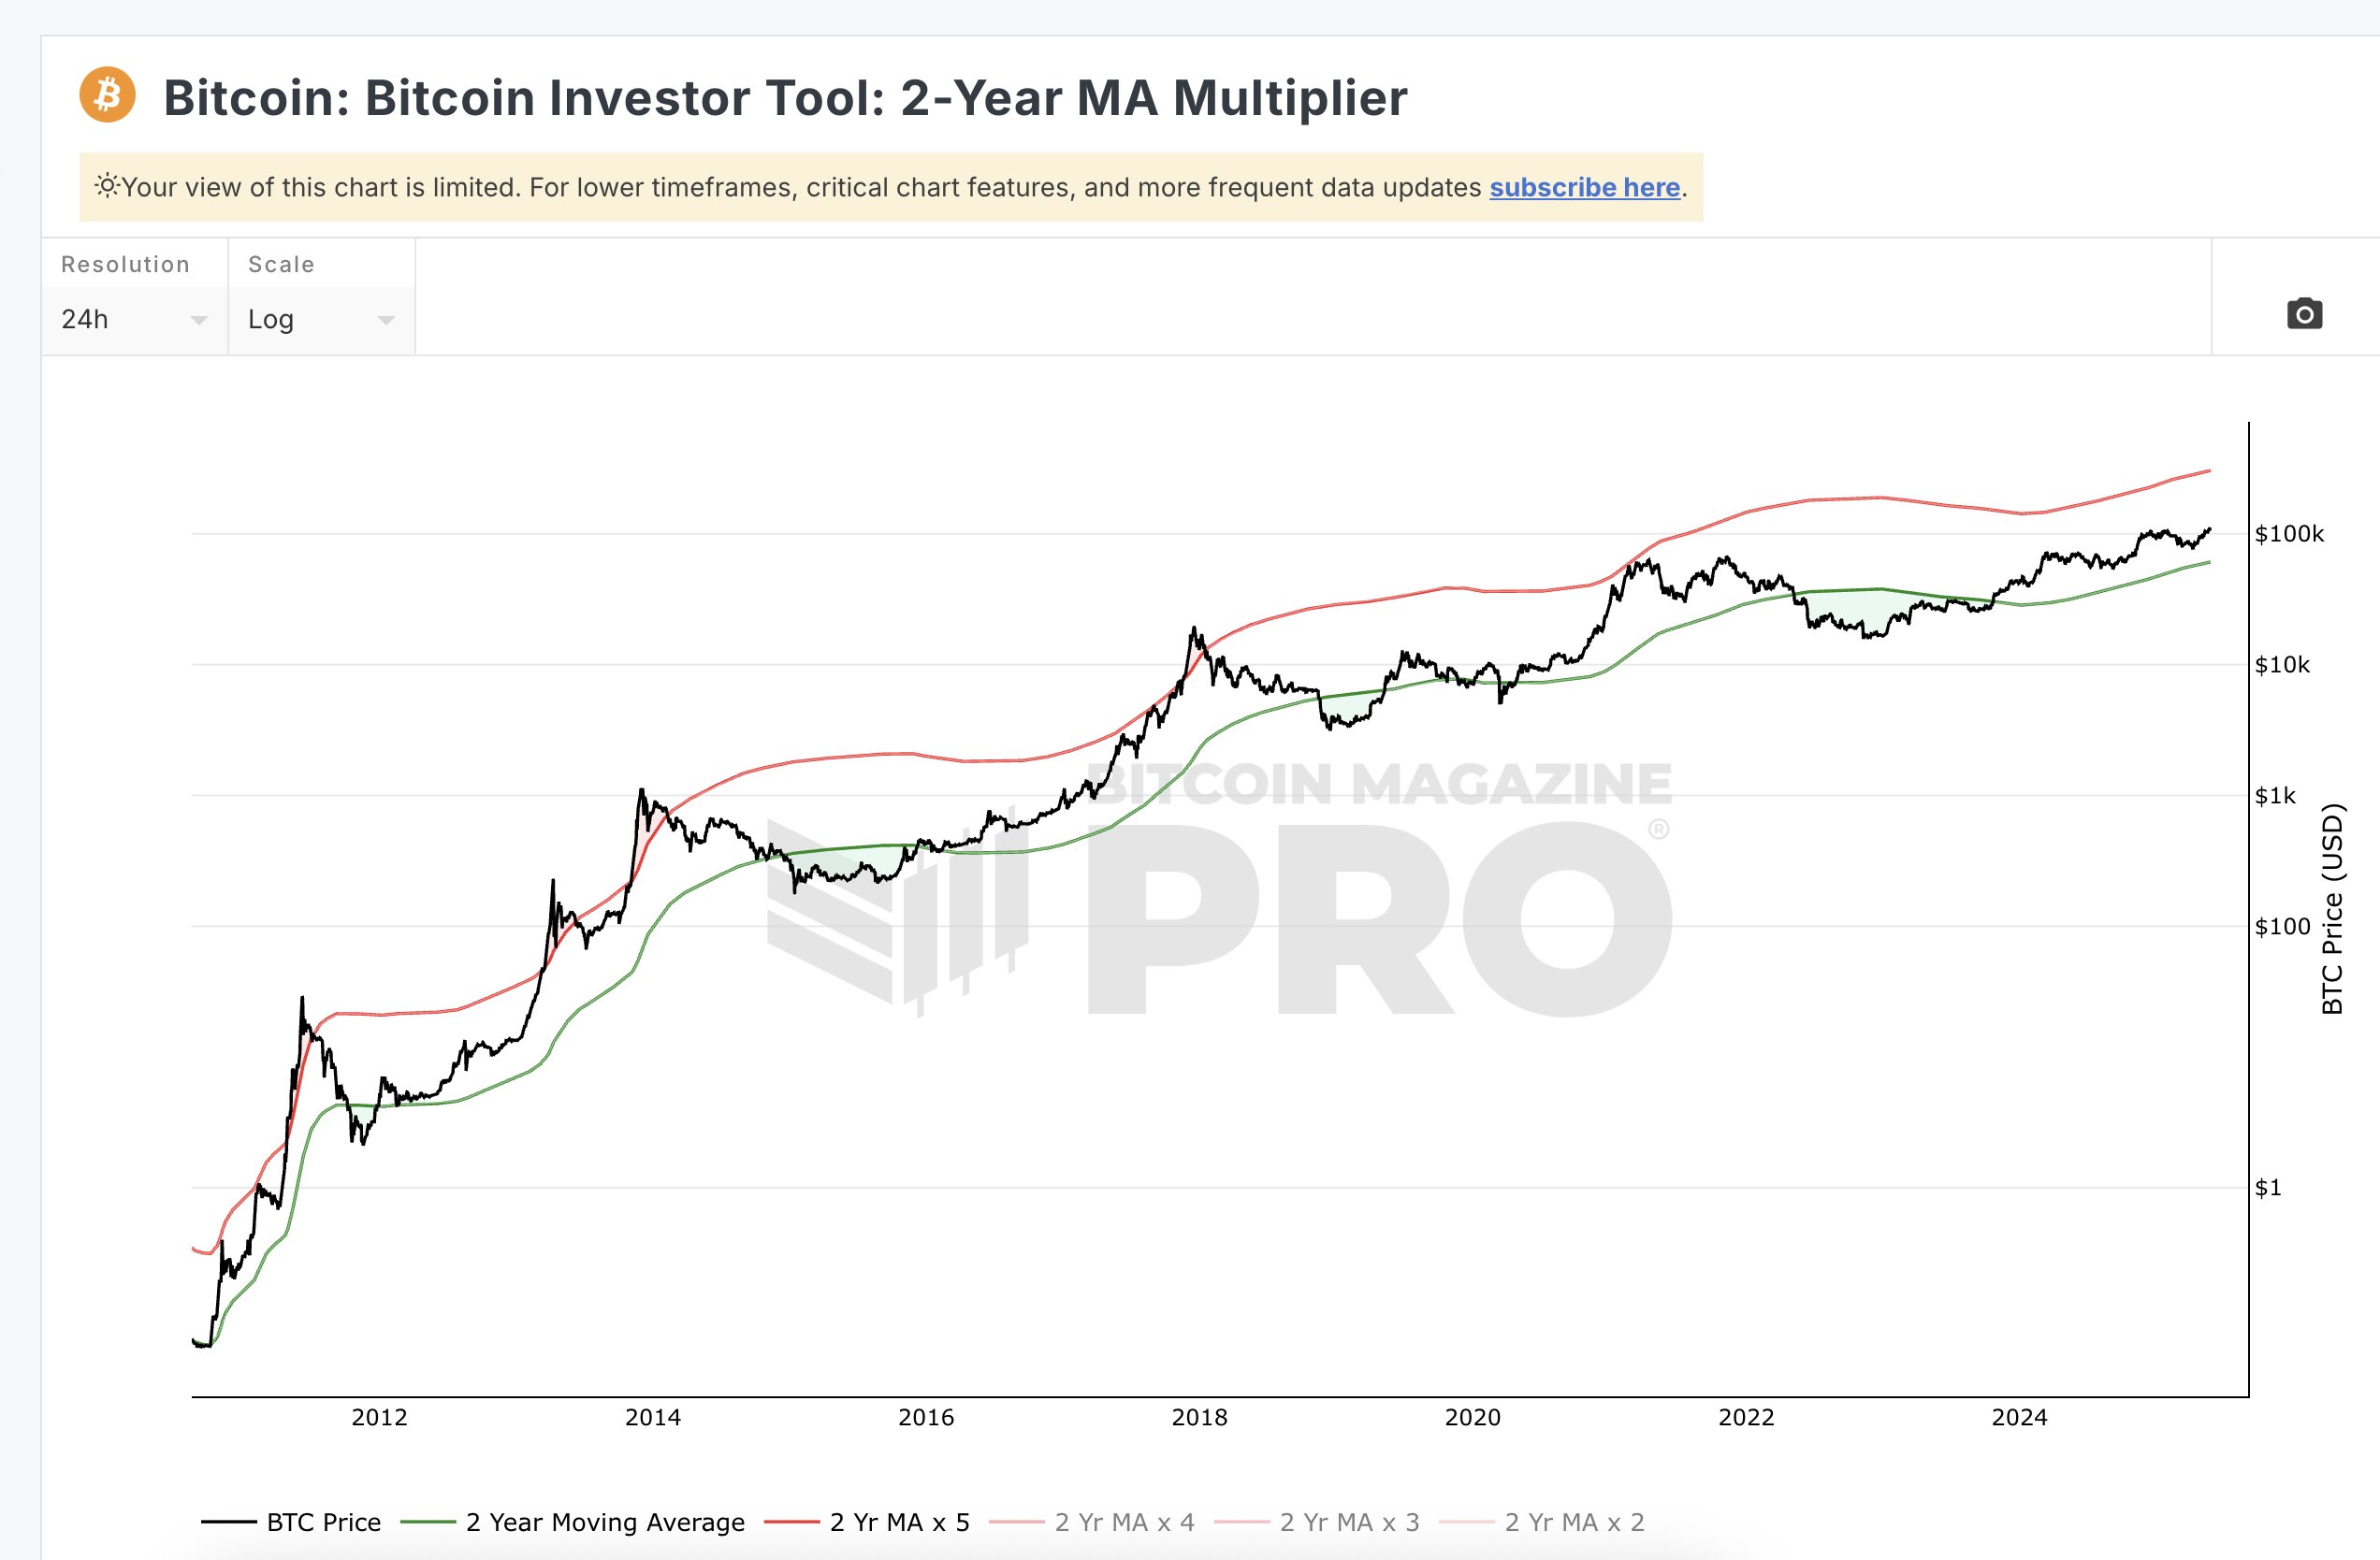
The Two-Year Moving Average (2-Year MA) Multiplier judges the market cycle position by comparing the current Bit price with the multiple of the 24-month moving average. The indicator uses 5 times the moving average as the overvalued red line and 0.5 times as the undervalued green line, with historical peaks often occurring when prices touch the red line. Its designer, LookIntoBitcoin, believes that this indicator captures the pattern of Bit's 4-year halving cycle, suitable for medium to long-term investors.
Currently, Bit price is at $109,300, with the two-year moving average around $65,000, and the multiplier is about 1.68, positioned between the red line (5 times) and green line (0.5 times), close to the neutral-to-high green zone. In November 2021, when the price reached $69,000, the multiplier touched 5, triggering a sell signal, followed by a market crash; during the 2018 bear market bottom, the multiplier fell to 0.4, signaling a buying opportunity. The current multiplier of 1.68 indicates that the market has not entered an overheated state, and the peak has not yet arrived.
Market Pulse: Institutional Enthusiasm and Approaching Pressure Levels
Behind Bit's rise, institutional funds have played a leading role. On May 26th, QCP Capital pointed out that Bit quickly rebounded from the weekend low of $106,000 to $110,000, thanks to continuous 30-day net inflows of spot ETFs (especially BlackRock's IBIT). The institution-led market trend contrasts sharply with low retail participation. Aoyon Ashraf emphasized that retail enthusiasm has waned, with both Google search heat and meme coin prices declining, traders operating cautiously, low funding rates, and increasing short positions, showing the market is moving towards a more sustainable trading mode.
CryptoQuant analyst Axel Adler Jr.'s prediction injects new variables into the market. He noted that the unrealized profit rate for short-term holders (1-3 months) is currently 27%, and historical data shows that when this indicator exceeds 40%, selling pressure often leads to price adjustments. Growing at a daily rate of 0.818 percentage points, he predicts this indicator will reach 40% on June 11th, potentially pushing Bit prices to $162,000. This level is a next pressure point, not a pullback target, suggesting that short-term upward momentum continues, but selling risks follow. Adler warns that this prediction does not consider "black swan" events, and investors should remain vigilant.
Market divergence further complicates the situation. QCP Capital noted that tech stock ETFs (like TQQQ) have been continuously outflowing since April, with the latest price at $66.32, down from the April high, reflecting investor rotation or hedging sentiment. MicroStrategy (MSTR) stock price diverges from Bit's rise, currently at $369.51, far below the year's high of $543. 10x Research suggests hedging MSTR risk through a put option strategy (buying a $370 strike put option and selling a $300 strike put option), highlighting its weakening momentum. These divergence signals show the maturity of the Bit market but also lay the groundwork for short-term volatility.
Conclusion
7 indicators consistently show that Bit has not yet peaked. The rainbow chart, 200-week heatmap, and two-year multiplier outline the upward space, RSI suggests short-term overbought risks, S2F and power law models paint a long-term vision, and the ahr999 indicator provides rational guidance. The $162,000 pressure point is close at hand, but pullback risks loom. Investors need to focus on PCE data and the June 11th node, seizing opportunities amidst volatility. Bit's journey tests patience and insight.


