

Key Points:
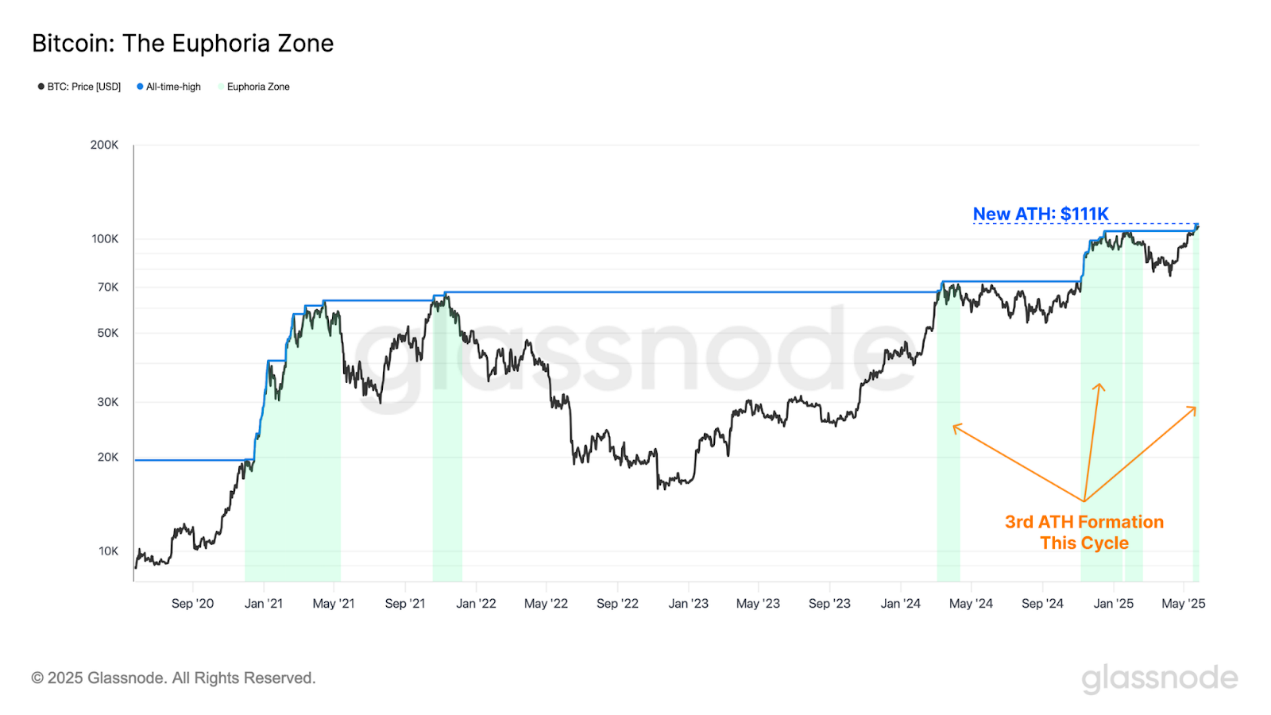
- Bitcoin market continues to strengthen, reaching a new high of $111,000, which is the third new high in this cycle.
- Investors' profit levels and selling behavior have significantly increased, but are still lower than the peak levels of previous bull markets.
- Interactions with exchanges have increased dramatically, with approximately 33% of Bitcoin on-chain transaction volume now occurring through centralized exchanges.
- Activity in the derivatives sector is also increasing, with significant growth in open interest in futures and options markets.
- If Bitcoin continues to rise, $120,000 will become a critical area. Based on on-chain price model crossovers in previous cycles, selling pressure is expected to accelerate in this region and its vicinity.
Bitcoin Breaks New High
The Bitcoin market remains strong, reaching a new high of $111,000, which is the third breakthrough in this cycle's historical high. Historically, the price discovery phase is often followed by brief selling as early profit-takers seize the opportunity to exit and reduce risk.
Bitcoin has followed this pattern, with the price falling back to $107,000 shortly after the initial breakthrough, then recovering and consolidating around $108,000 for the remainder of the week.
Bitcoin's performance has outpaced most asset classes amid challenging macroeconomic conditions and intensifying geopolitical tensions, making the overall outlook uncertain. This strong performance in a relatively difficult market environment is indeed an encouraging signal.
Source: glassnode
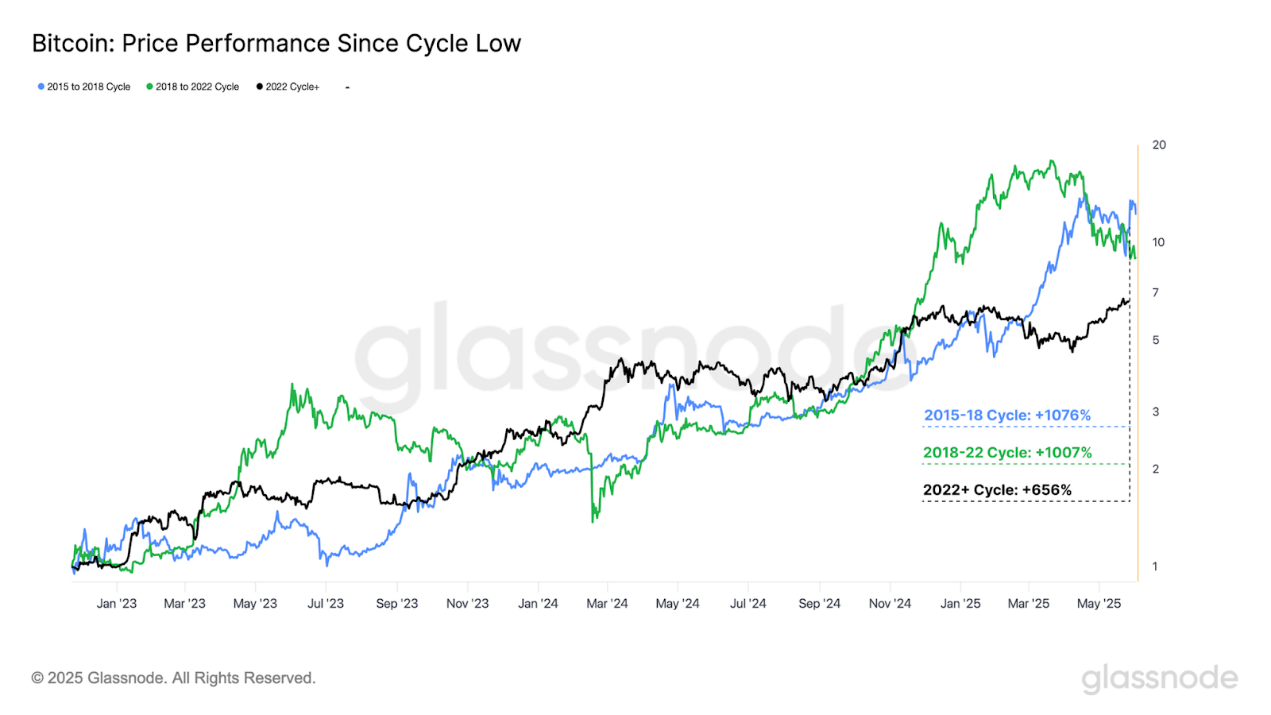
Comparing the current cycle's price performance with previous cycles reveals surprising structural similarities despite vastly different total market cap scales. The following chart shows performance since the relative cycle low point:
- 2015 to 2018 cycle: +1076%
- 2018 to 2022 cycle: +1007%
- 2022 and onwards cycle: +656%
Considering Bitcoin's significantly increased market cap, maintaining such close alignment with previous cycle trends is a remarkable achievement. This indicates that Bitcoin's demand scale is keeping pace with the asset's growth rate.
Source: glassnode
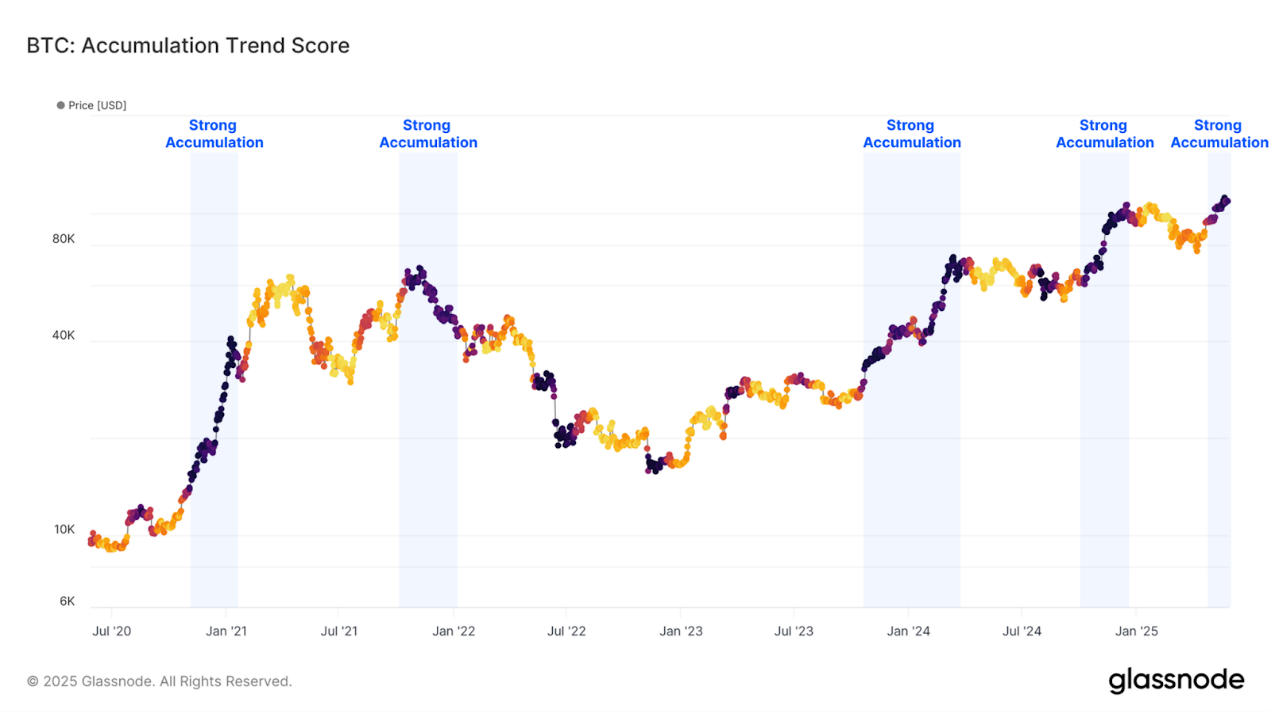
Assessing accumulation patterns across different wallet sizes reveals that new highs often trigger significant accumulation. This will drive the accumulation trend score closer to its maximum of 1.0.
It's noteworthy that accumulation pressure significantly increased when historical highs were reached at $70,000 in March 2024 and $107,000 in November. This indicates investors tend to buy heavily when the market enters a price discovery phase, but also shows existing holders are prone to taking profits at higher prices. This "herd effect" highlights the convergent behavior of market participants at key psychological price levels and events like breaking new highs.
In contrast, the previous cycle's peak of $69,000 in November 2021 faced massive accumulation pressure during and after reaching the peak. This ultimately marked the cyclical top and initiated a prolonged bear market in 2022. While strong accumulation is typically a positive signal, it's crucial to recognize that overwhelming consensus behavior is not always a reliable indicator of future direction (and may actually be a contrary indicator).
Source: glassnode
[The translation continues in the same manner for the rest of the text, maintaining the specified translation rules for specific terms.]Currently, the average token deposited in exchanges is profitable at around $9,300, while the average token in a loss state is only $780. This difference indicates that current trading behavior is primarily profit-driven, reflecting a significant change in investor sentiment. The average profit is 12 times the loss, with the ratio approaching the extreme levels typically seen during the most active stages of a bull market. The extreme levels of the exchange's average profit and loss ratio further suggest that the market is entering the euphoric phase of a bull market. As centralized exchange activity increases, examining the derivatives market becomes increasingly important to understand the accumulated leverage in a bull market environment. Since touching a local low of $74,000 in April, futures contract open interest has significantly grown from $36.8 billion to the current $55.6 billion. In just the past 49 days, it has increased by $19 billion (a 51% growth), indicating rising leverage levels. Meanwhile, options contract open interest has surged from $20.4 billion to $46.2 billion, reaching a historical high. The growth of $25.8 billion is notably higher than the futures market's open interest increase. The rapid increase in options open interest reflects the growing sophistication of the investor community, who are increasingly using options contracts to execute more complex strategies for optimizing risk management and trading positions. Regarding spot ETFs, buyers have continued to purchase since late April, and the trend remains strong. Over the past week, daily ETF inflows have exceeded $300 million. This massive and continuous buying from retail and institutional investors demonstrates continued confidence in the asset and has been a key driver of market new highs since its launch in 2024. As Bitcoin returns to the price discovery phase, on-chain data and technical indicators can be used to assess market momentum and identify potential overheating signs. The 111-day moving average (DMA) and 200-day moving average are common technical indicators for evaluating Bitcoin market momentum and trend strength. The short-term holder cost on-chain indicator can supplement these technical price models, reflecting the average purchase price of new market investors. Currently, Bitcoin's price is far above these three key levels, highlighting the strong market rebound since April. Notably, these price levels are very close numerically, forming a convergence in the critical support area. Using the Market Value to Realized Value (MVRV) ratio can help define price ranges and highlight extreme deviations from average investor costs. Currently, Bitcoin's price is fluctuating between the +1σ and +0.5σ intervals, indicating a relatively active market with room for further appreciation before reaching extreme levels of unrealized profits. Bitcoin has reached a new all-time high of $111,000, the third new high in this cycle. This milestone has triggered broad activity across major market sectors, characterized by increased investor profits, profit-taking, enhanced exchange interactions, significant growth in futures and options open interest, and continued spot ETF buyer demand. As the market enters the price discovery phase, the $120,000 level appears to be a critical area, with sell-side pressure expected to accelerate in this region and its vicinity.


