

CAKE, the native token of decentralized exchange (DEX) PancakeSwap, recorded the largest increase today, going against the overall market trend.
The token saw a slight increase of 3% over the past 24 hours. Major assets like Bitcoin (BTC) and Ethereum (ETH) declined by about 1% during the same period. Technical indicators suggest that the upward trend could continue due to strong market demand.
CAKE Rises with 88% Surge in Trading Volume
Despite the market downturn last week, CAKE recorded an upward trend. Currently trading at $2.48, it has increased by 9% since May 31st.
This upward trend continues today, with CAKE's price rising and trading volume surging. The token's trading volume increased by 88% over the past day. This indicates growing investor interest and increasing demand for DeFi assets.
When an asset's trading volume rises alongside its price, it signifies strong buying interest and confirms the strength of the upward trend. This combination suggests increasing investor confidence in CAKE and implies a potential continuation of the upward trend in the short term.
Moreover, the BBTrend indicator for altcoins supports this upward outlook. Observed on the daily chart, this indicator is currently at 12.76 and has only posted green histogram bars since May 9th.
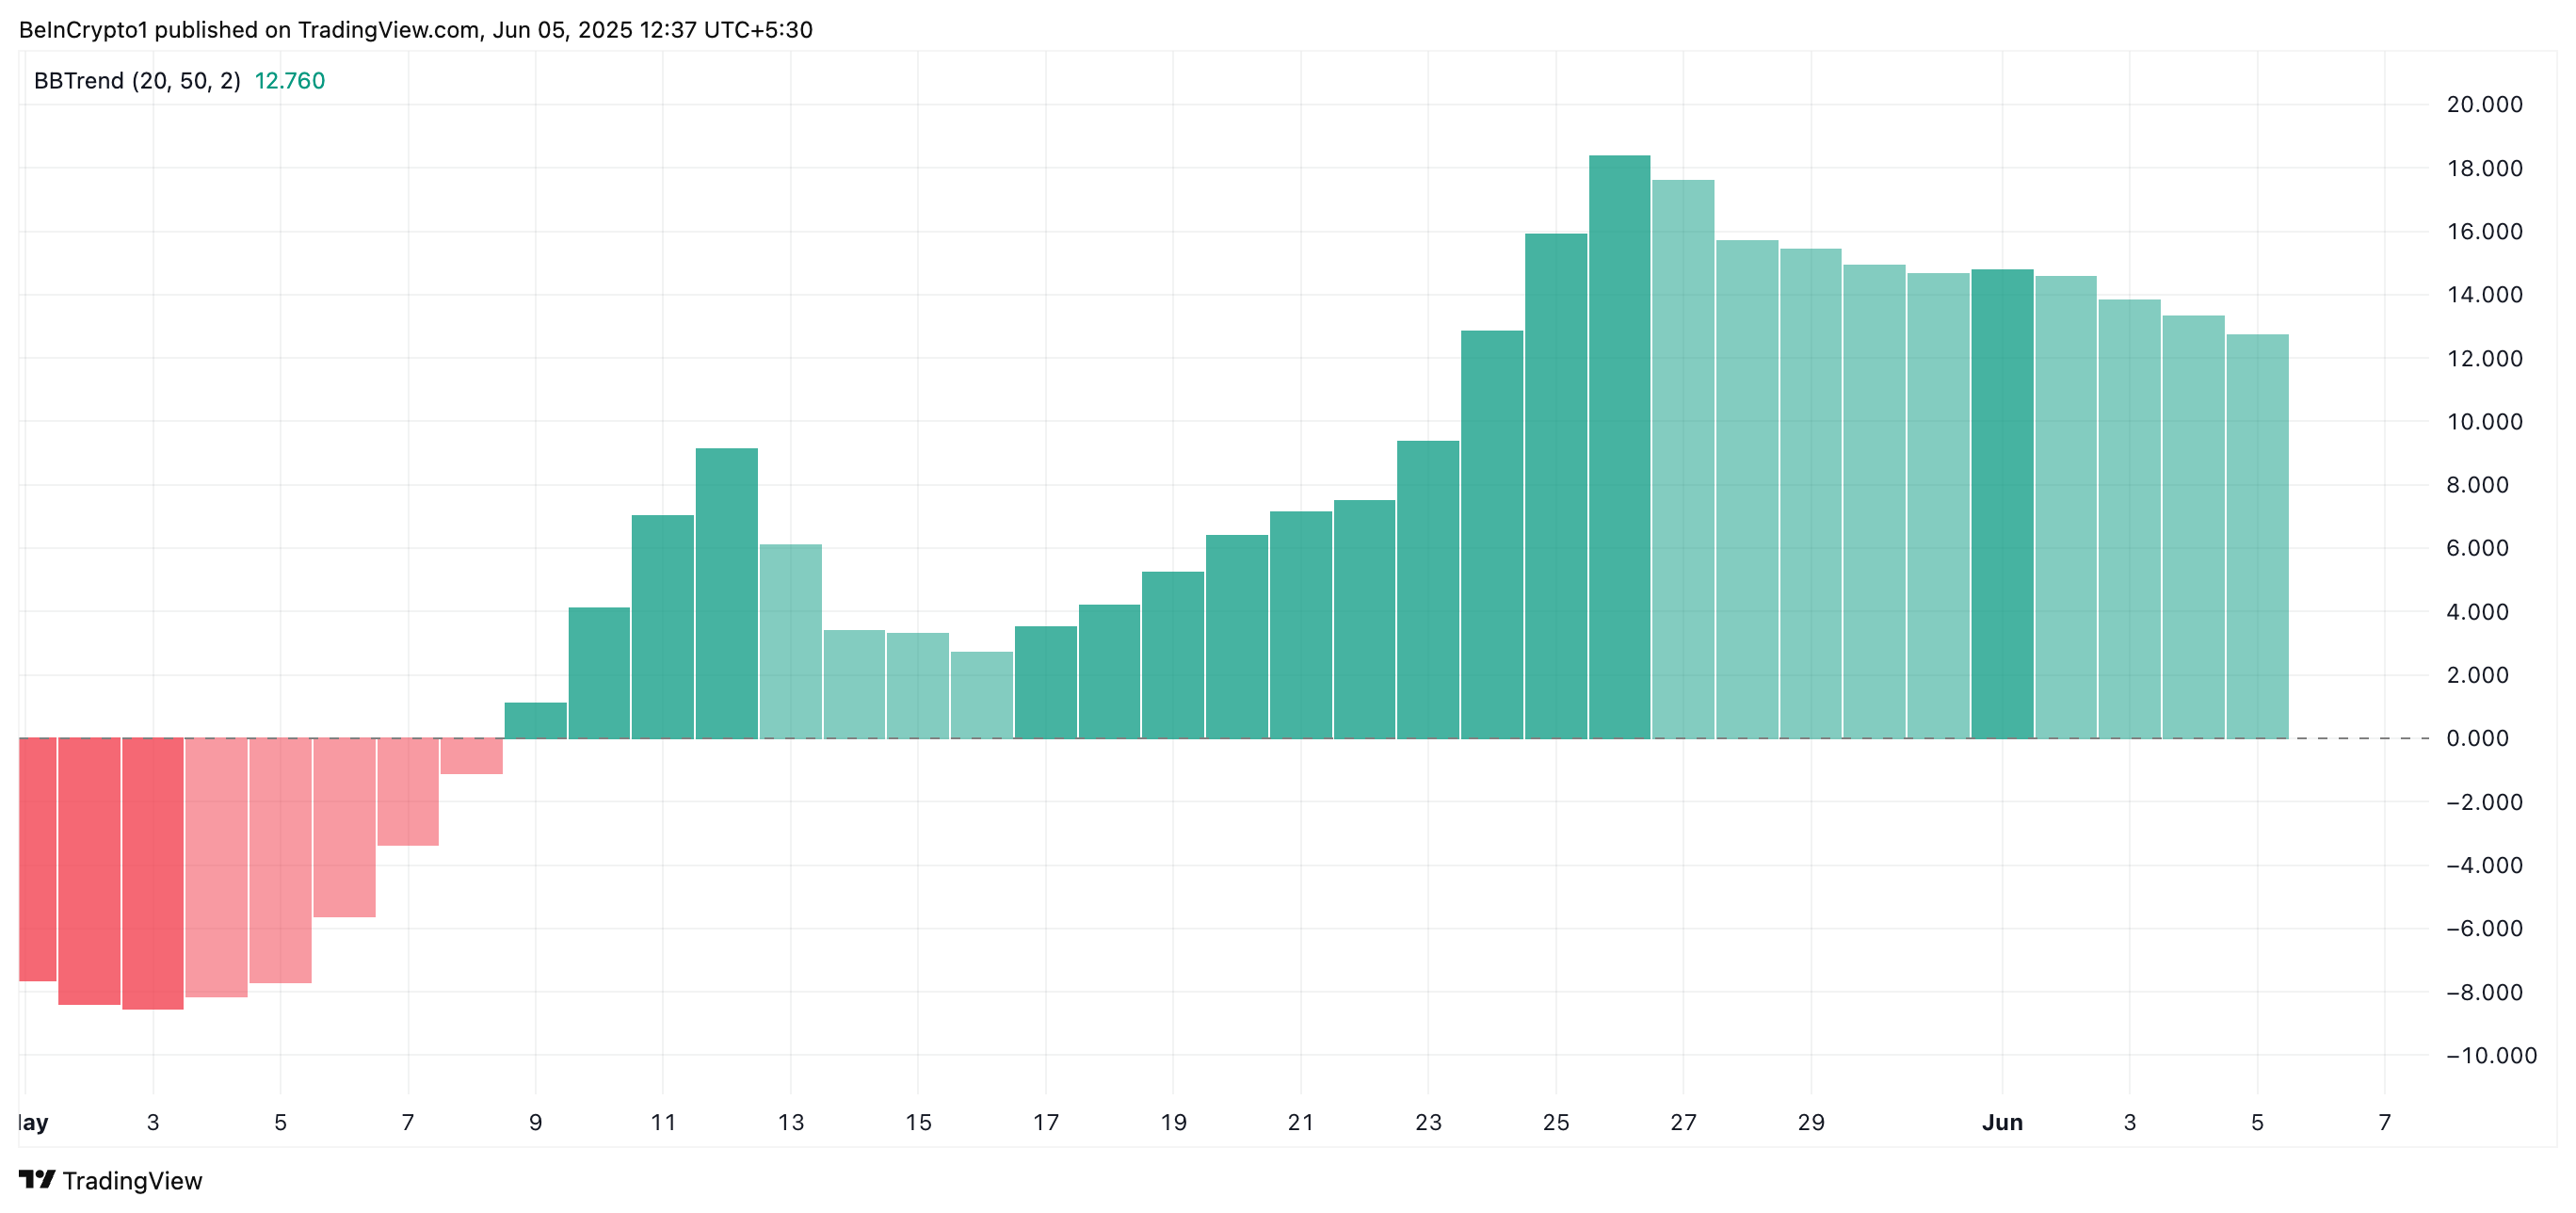
BBTrend measures the strength and direction of a trend based on Bollinger Bands' expansion and contraction. When returning red bars (negative values), the asset's price consistently closes near the lower Bollinger Band, reflecting continuous selling pressure and suggesting further potential decline.
Conversely, when the BBTrend value is positive, as with CAKE, it typically indicates a strong upward trend. At 12.76, the momentum indicator confirms increasing upward pressure among CAKE holders, suggesting room for the current rally to continue.
CAKE Strength Indicators Emerge… Will It Maintain $2.81?
CAKE's rising Relative Strength Index (RSI) adds credibility to these upward prospects. At the time of writing, this indicator is at 54.75 and trending upward.
The RSI indicator measures an asset's overbought and oversold market conditions. It ranges from 0 to 100. Values above 70 indicate an overbought asset with expected price decline, while values below 30 suggest an oversold asset with anticipated rebound.
CAKE's current RSI setting shows a steady increase in token accumulation, a pattern that could drive further price increases.
If the current sentiment and volume levels persist, CAKE could extend its upward trend to $2.81 in the short term.
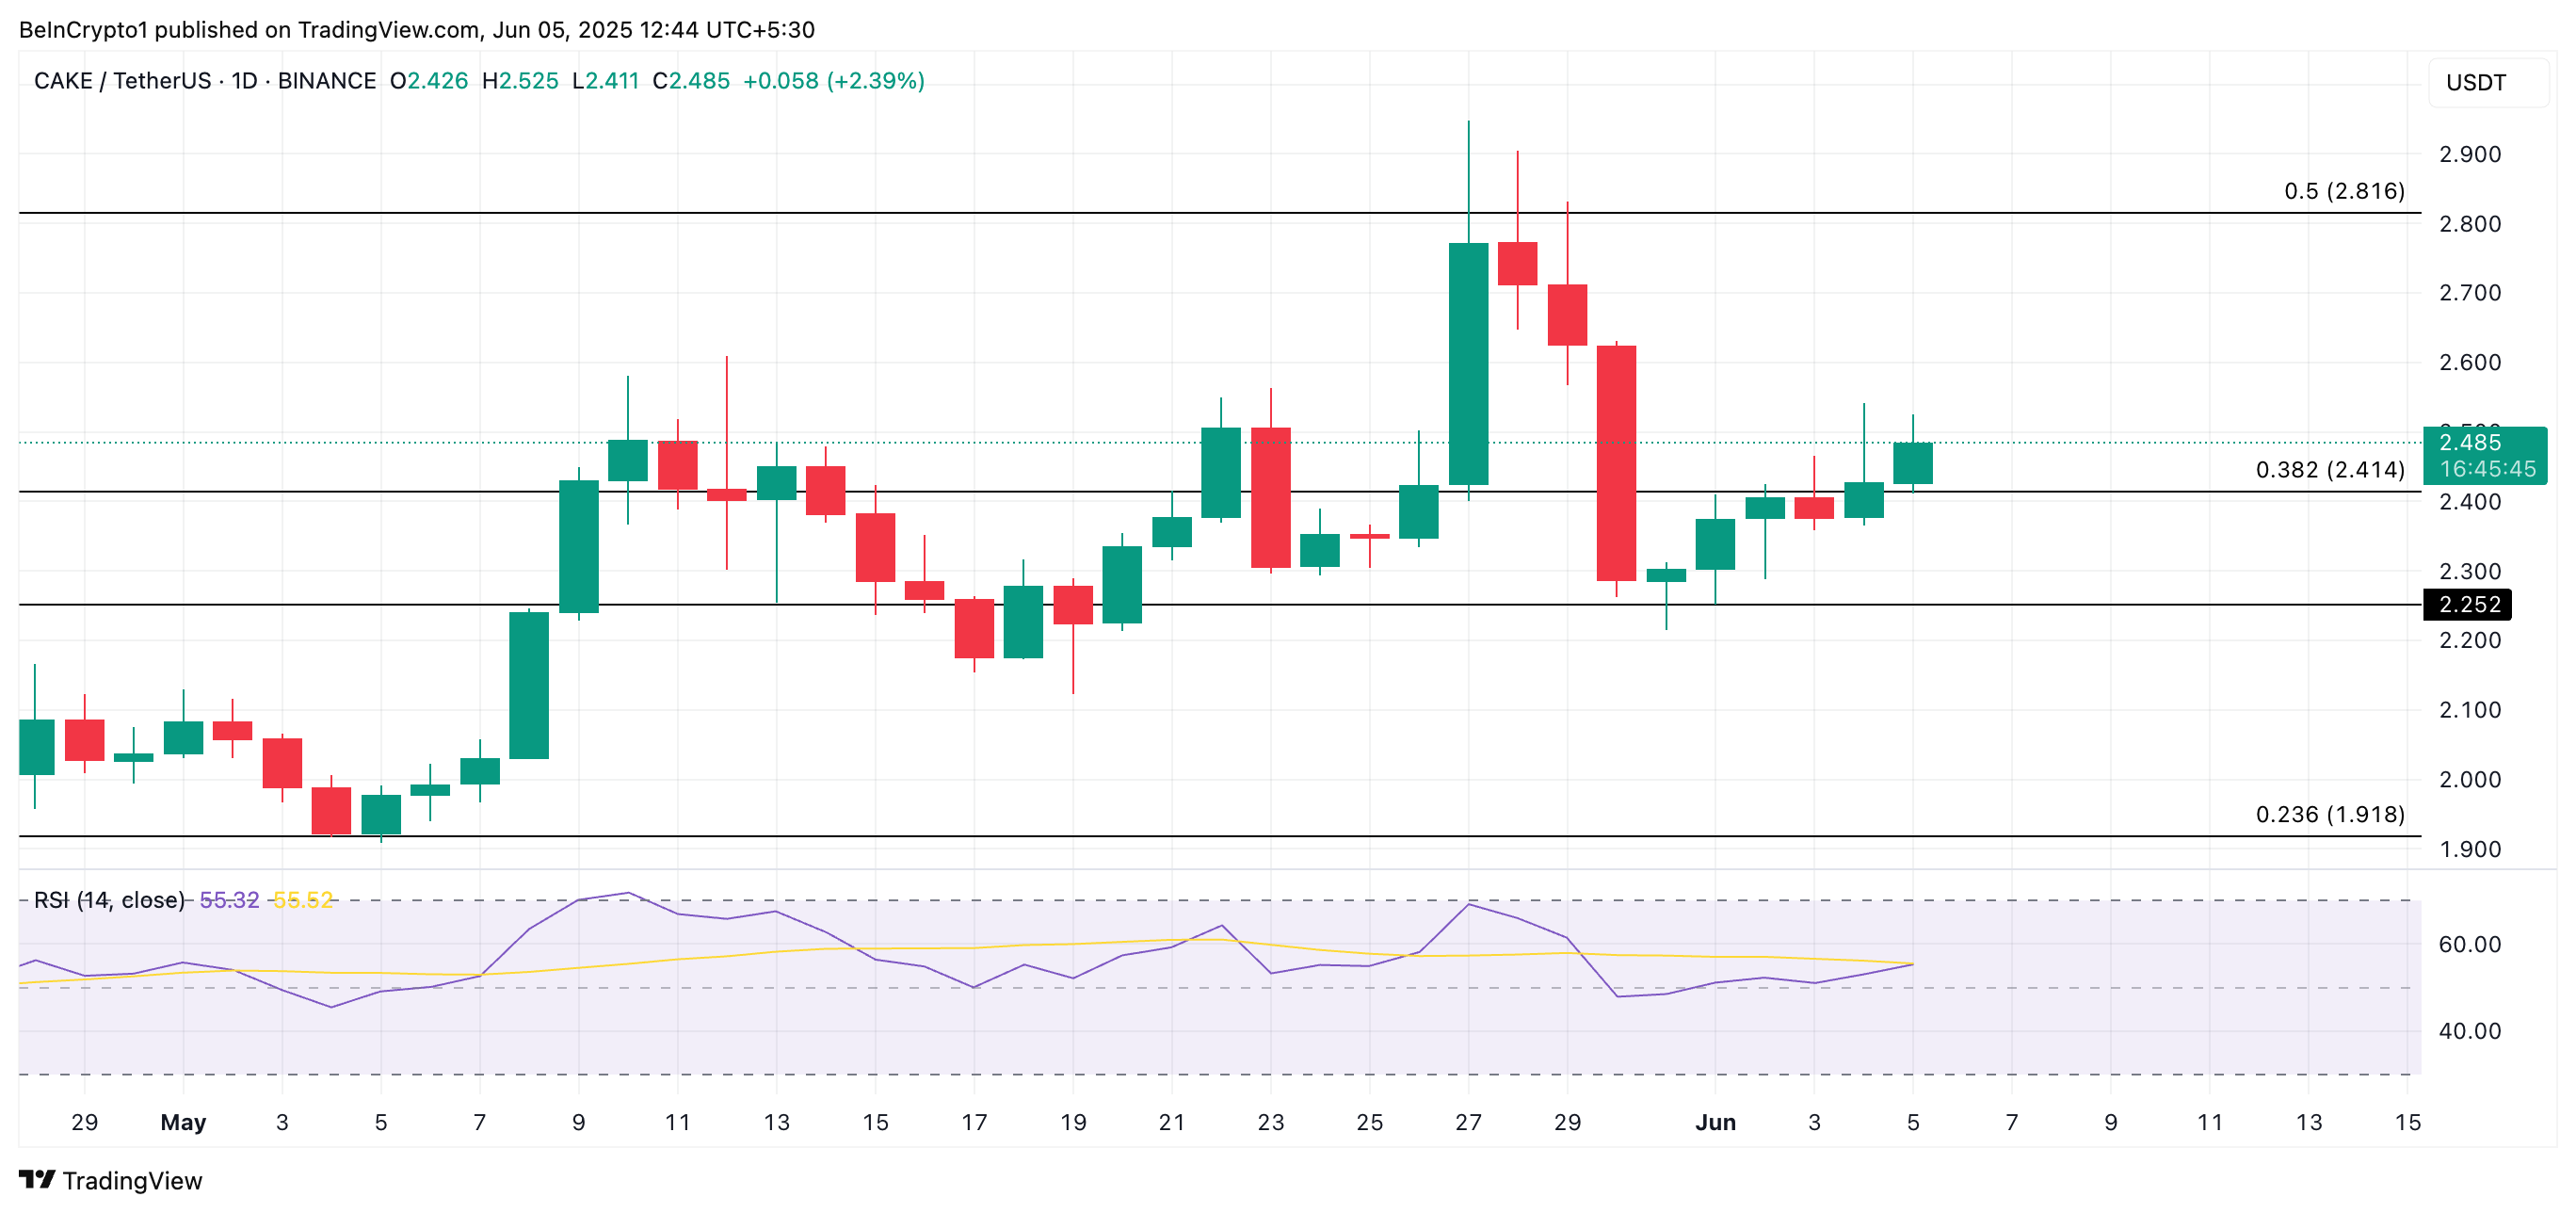
Conversely, if demand decreases, CAKE could fall below the $2.41 support line, potentially dropping to $2.25.


