The ETH/BTC ratio, used by traders to measure Ethereum's relative strength against Bitcoin, has maintained a tight consolidation range since mid-May. This indicates that the altcoin continues to underperform the market-leading cryptocurrency.
Despite this stagnation reflecting weakened investor interest in ETH, it also signals a broader delay in the start of a full altcoin season.
Altcoin Season Pauses as ETH Struggles
Reading from the daily chart shows the ETH/BTC ratio has moved within a narrow range since May 13. It faces resistance at 0.026 while finding support at 0.023.
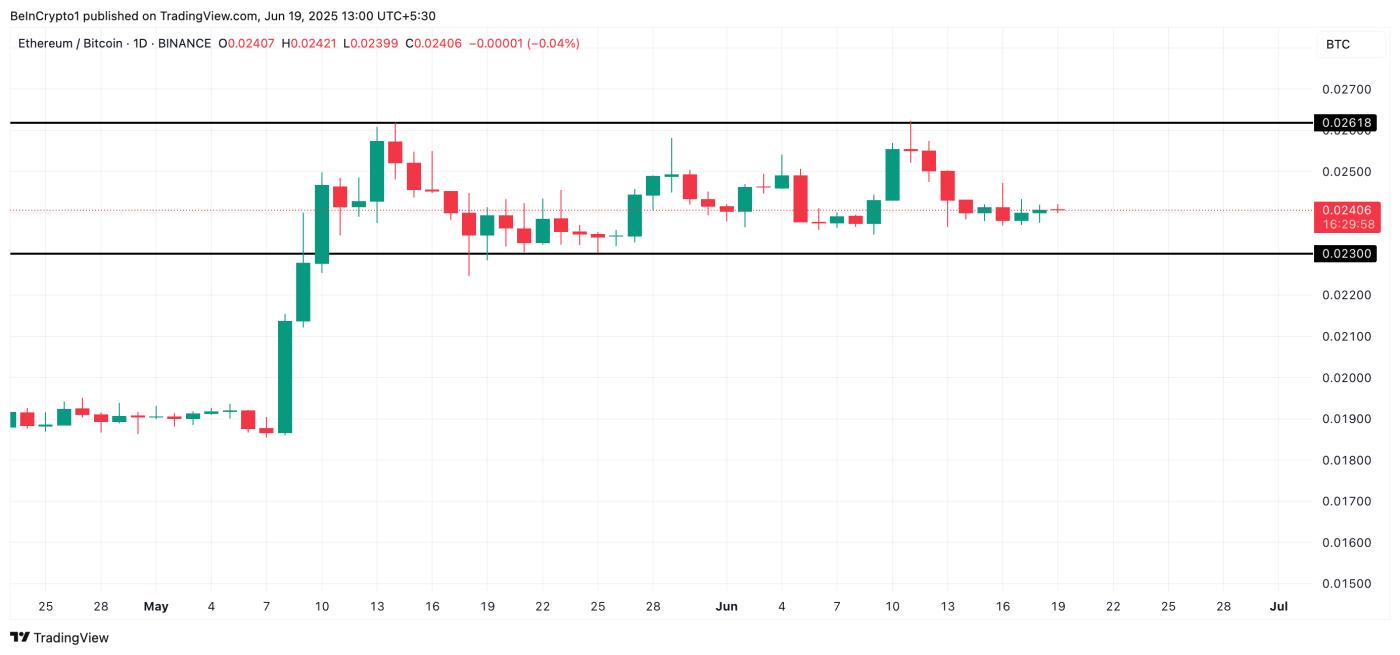 ETH/BTC Ratio. Source: TradingView
This ratio measures ETH's price performance relative to BTC, showing which asset is appreciating faster. Historically, sustained increases in the ETH/BTC ratio often signal broader altcoin price increases, as ETH typically leads capital movement away from BTC.
However, the current sideways trend indicates traders remain cautious and focused on BTC, especially amid ongoing geopolitical tensions.
This trend is notable as it raises concerns that the anticipated altcoin season may be further delayed.
In a June 18 post on X, Crypto Fella emphasized that the ETH/BTC chart is the "most important chart to watch" for anyone expecting an altcoin season return.
Chart reading shows the pair oscillating around 0.024, where previous cycle dips formed. Similar structures in 2019 and 2020 saw ETH strongly recover against BTC after prolonged weak performance. However, as Crypto Fella pointed out, "we need to see some strength before we can see a major reversal."
 ETH/BTC Ratio. Source: X
Therefore, a decisive breakout above the critical resistance at 0.026 is crucial to signal the start of a broader altcoin revival.
Moreover, the Altcoin Season Index indicates the market is still in a BTC-dominated phase. An altcoin season begins when at least 75% of the top 50 altcoins outperform BTC over a three-month period.
 Altcoin Season Index. Source: Blockchain Center
Only 25% have achieved this in the past 90 days, showing a clear delay in altcoin performance and suggesting a true altcoin season may still be far off.
ETH Struggles Below 20-Day EMA
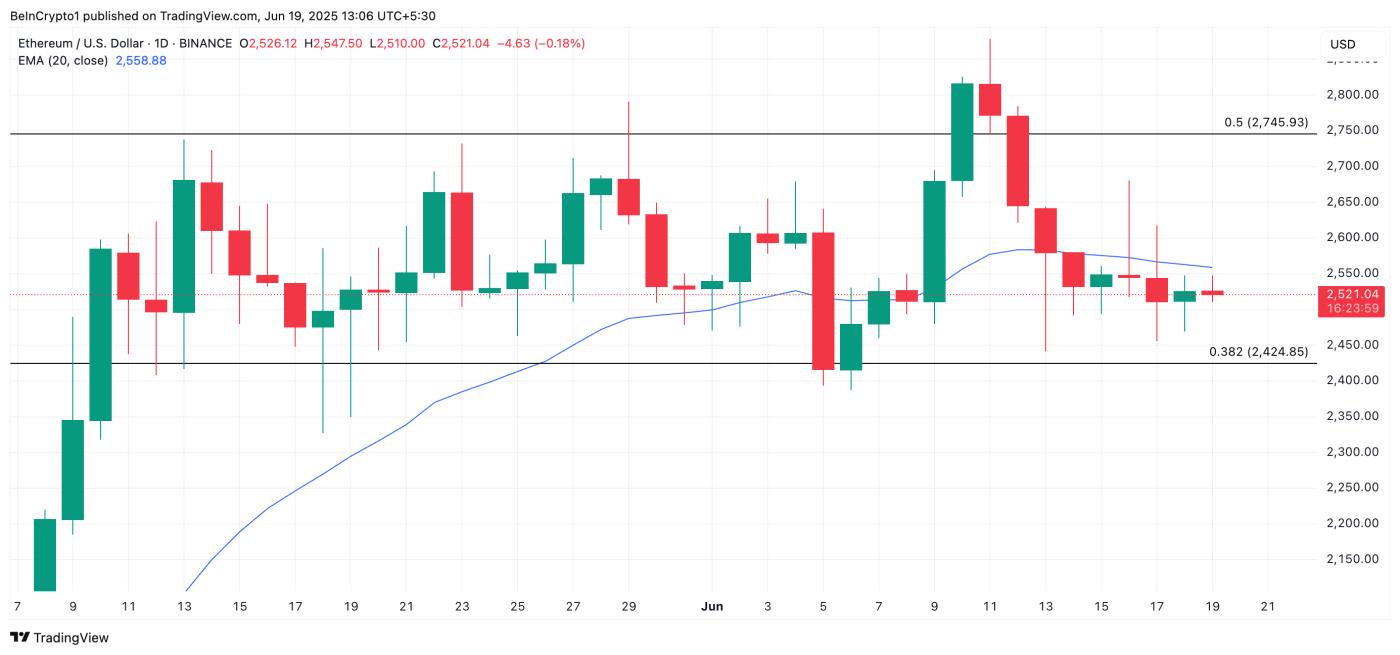
ETH trades at $2,521 at the time of writing, recording a modest 0.15% increase over the past day. On the ETH/USD daily chart, the altcoin trades below the 20-day Exponential Moving Average (EMA), confirming price weakness amid increasing geopolitical tensions in the Middle East.
The 20-day EMA measures an asset's average price over the most recent 20 trading days, prioritizing recent prices. When price trades below the 20-day EMA, it signals short-term downward momentum and indicates sellers are in control.
If this continues, ETH could drop to $2,424.
 ETH Price Analysis. Source: TradingView
However, if demand increases, ETH's price could break above the 20-day EMA and recover to $2,745.