The price of Pi Network is at a dangerous level. Currently trading slightly above 0.44 USD, this token risks a 10% drop to the 0.40 USD zone.
However, while most indicators signal red, an important signal suggests that buyers may still be watching. If PI's price can recover to 0.47 USD, this price decline pattern could be completely neutralized.
Supertrend signals red
The Supertrend indicator, commonly used to determine market direction, has been above PI's daily candles since mid-June. Simply put, when Supertrend appears on the price action and is colored red, it signals a strong downward trend; think of it as a warning light for traders, "Don't buy right now."
This red zone has continued to expand downward, indicating that sellers are still maintaining tight control.
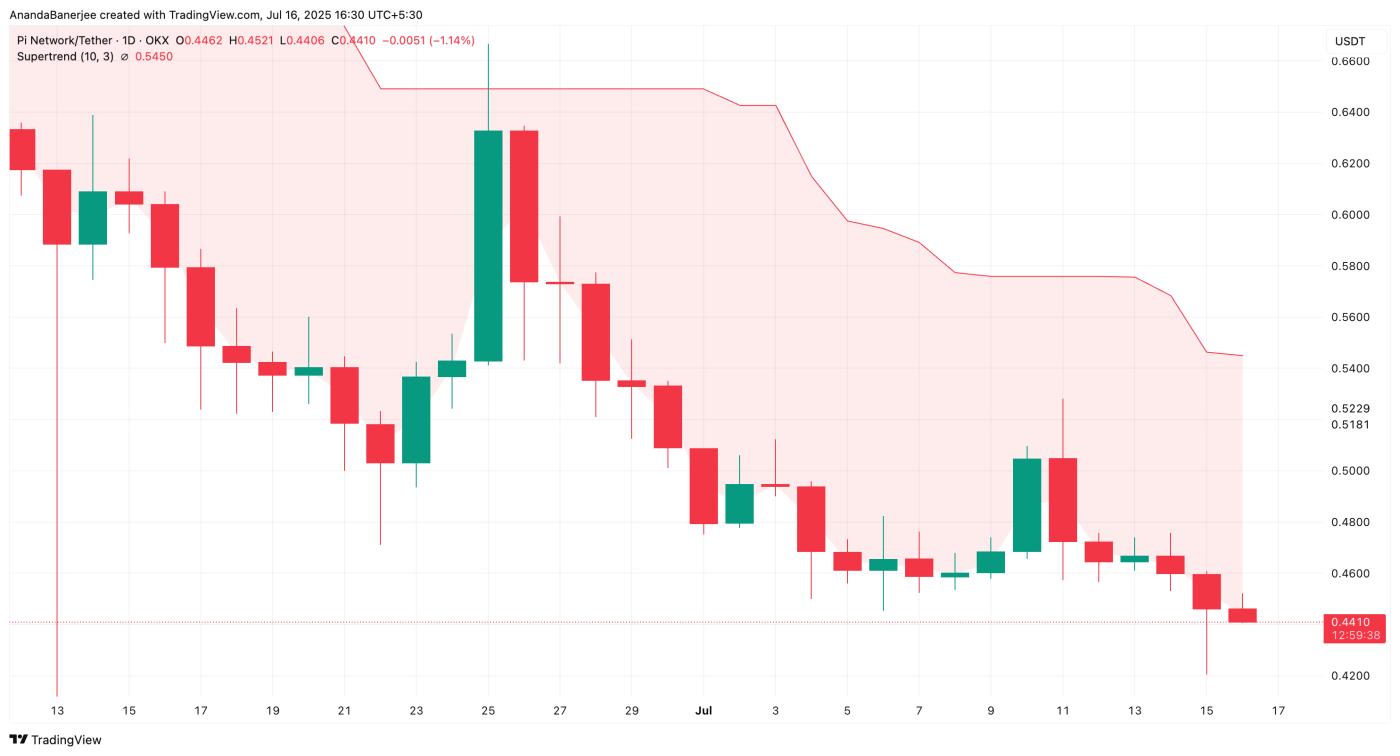 PI Price and Supertrend Indicator: TradingView
At the time of writing, the Supertrend resistance threshold is at 0.5450 USD, much higher than the current price. Unless PI closes above that level, the signal remains bearish.
RSI Price Divergence is the Only Hope
Now for the surprise. Despite the declining price trend, the Relative Strength Index (RSI) is showing a hidden bullish divergence.
PI's price has created lower Dips from late June to 15/07, but RSI, a momentum indicator, is creating higher Dips. This mismatch often suggests that although the price looks weak, buying pressure is quietly increasing beneath the surface.
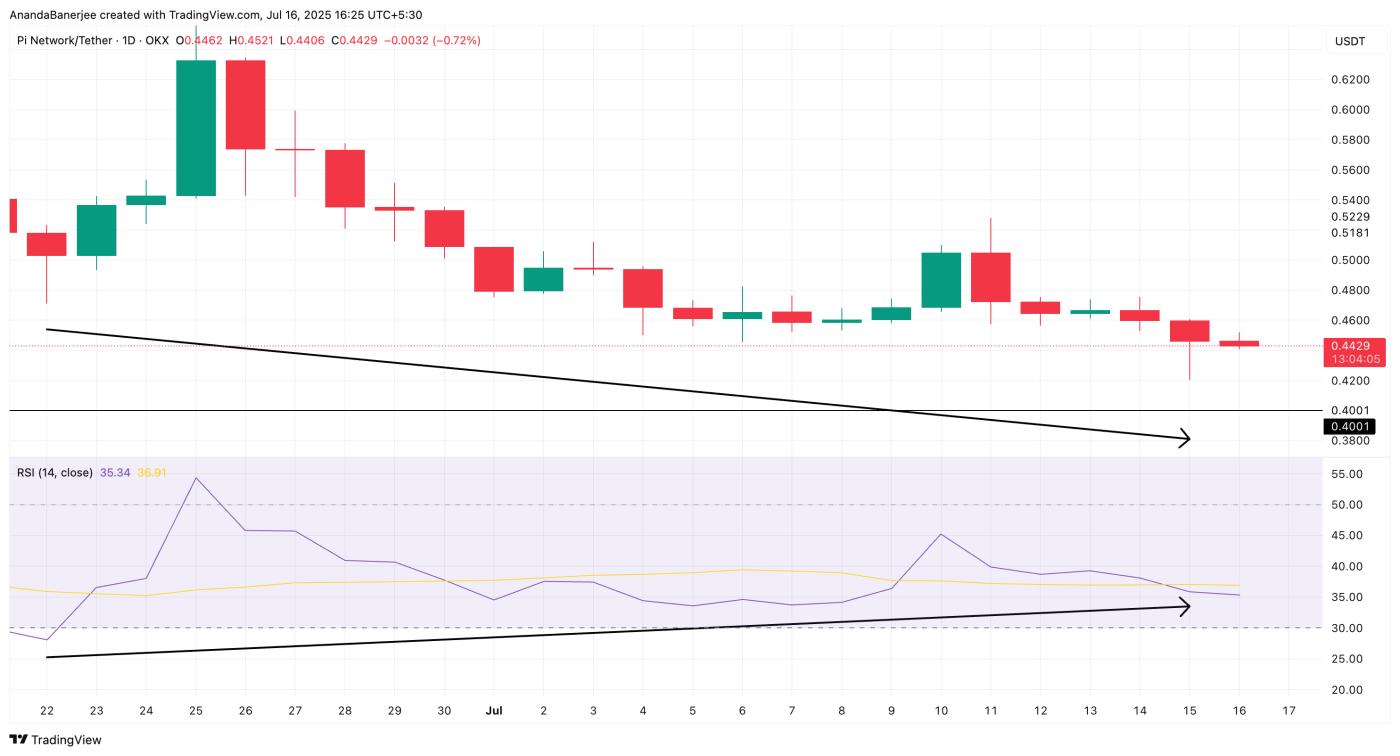 PI Price and RSI Divergence: TradingView
The Relative Strength Index (RSI) measures momentum by tracking a coin's price change speed and magnitude — values below 30 indicate it's oversold, while values above 70 mean it's overbought. Currently, PI is approaching 36 on the RSI, suggesting it may soon enter the oversold zone. If market sentiment remains optimistic, coin/token prices often rise after entering the oversold zone.
Exchange Flow Still Not Promising
Despite potential improving momentum, exchange inflows tell a different story. In the past 24 hours, over 5.7 million PI have entered CEX wallets, according to data from PiScan. This typically indicates ongoing selling pressure, as traders move assets to exchanges to potentially sell.
 Pi Coin Inflow Continues to Lead: PiScan
PI Price Analysis Suggests 10% Decline
In terms of price structure, Pi Coin has lost the 0.23 Fibonacci level at 0.47 USD and is currently consolidating around 0.44 USD. The primary support is at 0.42 USD, and if this level is broken, the market could drop an additional 10% from its current level.
This Fibonacci retracement pattern is drawn from the last swing high (0.0067 USD) to the recent swing Dip (0.4200 USD) and helps outline the price decline risk, or more accurately, the downward trend.
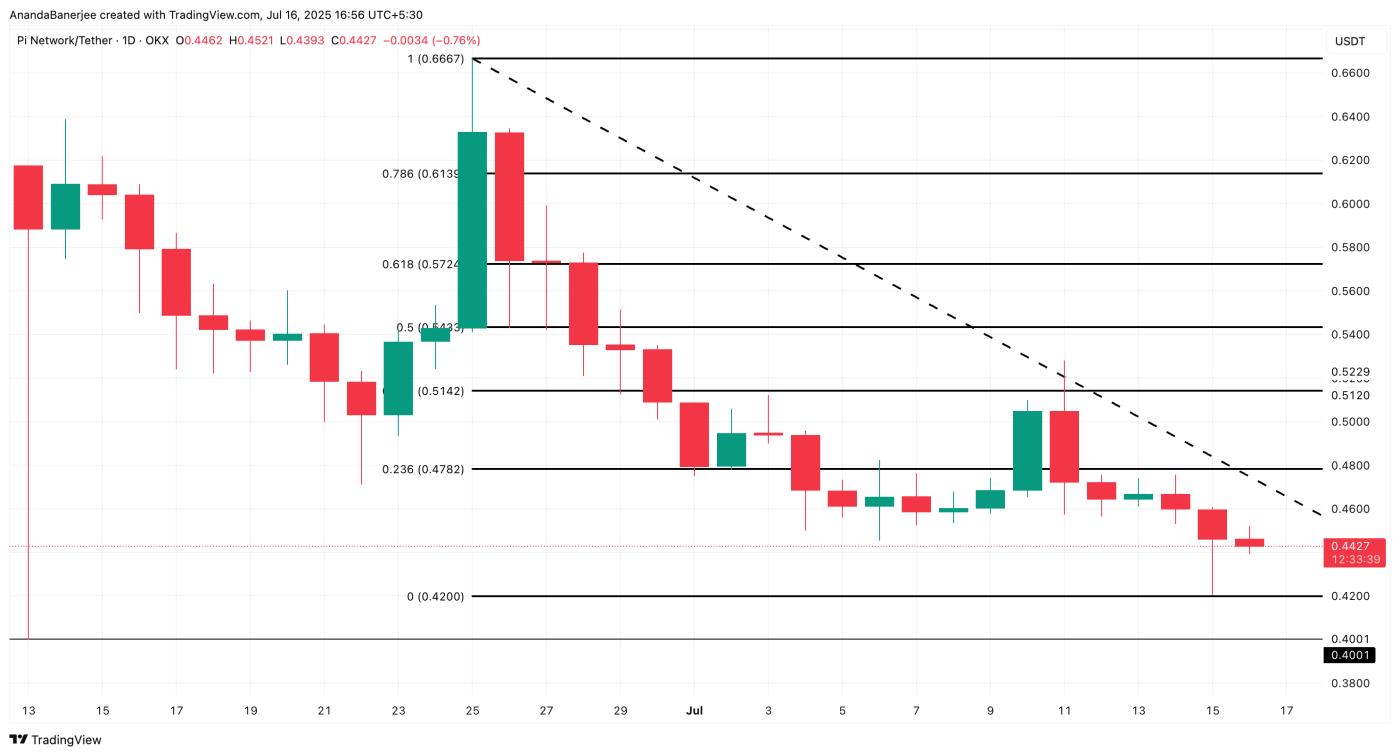 Pi Price Analysis: TradingView
If PI's price can transform 0.47 USD into support, reclaiming the Fib level, buyers might regain short-term control. But until that happens, the trend remains bearish. A clear uptrend will emerge if PI can surpass 0.5142 USD.
PI risks a 10% drop to 0.40 USD unless a bullish price divergence occurs. Currently, sellers are in control, but momentum indicators suggest this may not last forever.