The market, project, cryptocurrency, and other information and views mentioned in this report are for reference only and do not constitute any investment advice.Written by 0xBrooker
BTC Price Trend Daily Line
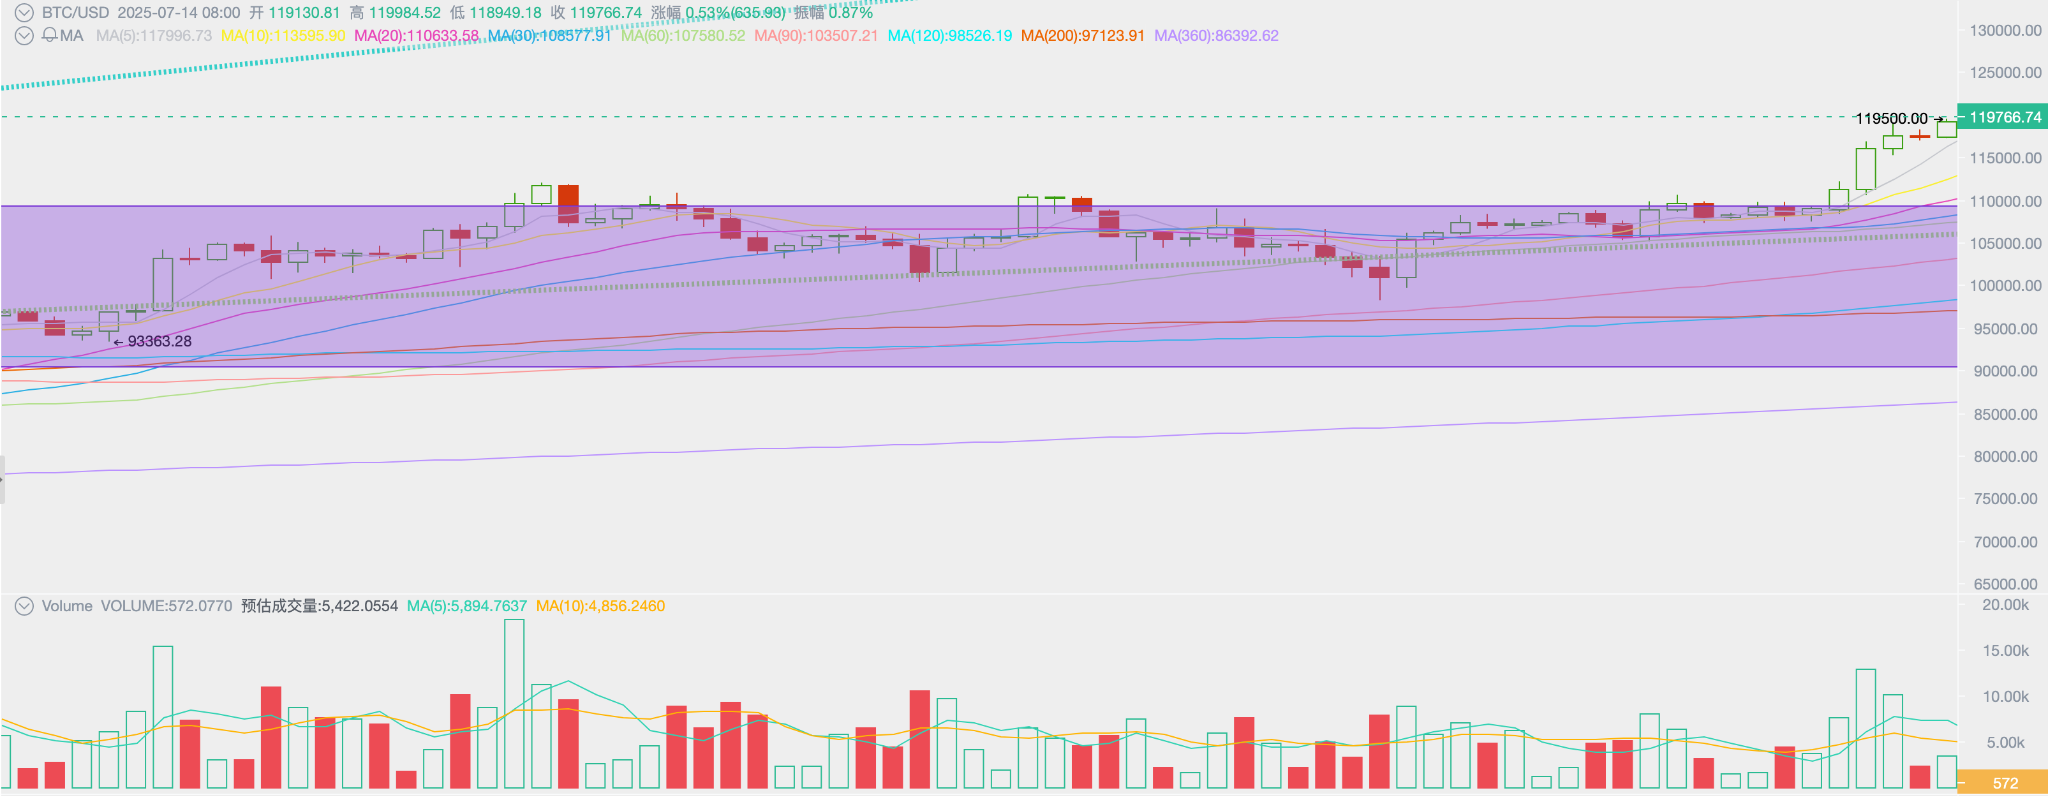
This week, BTC opened at $109,217.98, closed at $119,130.81, rising 9.08%, with a high of $119,500, a low of $105,119.70, and a volatility of 11.04%, with moderately expanded trading volume.
In last week's report, we mentioned that "some positive changes are happening, and the activity of internal funds has begun to increase after being dormant for over a month. This enhancement may resonate with external funds and drive BTC to launch the fourth wave of this bull market." This week, the resonance between internal funds and strong buying power from the BTC Spot ETF external funds channel pushed BTC to a new historical high.
Meanwhile, uncertainties have suddenly increased from the "peer tariff war" chaos and unexpected employment market information leading to rate cut expectations, which are worth close attention.
Policy, Macroeconomic, and Economic Data
Tariff war and US employment data were the main factors affecting the market this week.
On July 10, Trump announced a 35% unified tariff on all Canadian imports starting August 1. On July 12, Trump demanded market opening, threatening 30% tariffs on Mexico and the EU if no agreement is reached by August 1. Previously, the US had already sent letters to Japan and South Korea setting tariff rates at 25%.
Additionally, on July 12, Trump sent a unified letter to 23 other countries, specifying 20-50% tariff rates, but countries can negotiate reductions before August 1.
Currently, the tariff rates for major trading partners exceed market expectations. Meanwhile, the $3.4 trillion "Big Beautiful Bill" tax reform and expenditure bill is entering deep review in the Senate, with the US deficit rate potentially reaching 9% in fiscal year 2026. The "double-edged combination" of fiscal expansion and tariff inflation is causing the market to re-evaluate stagflation risks. Influenced by policy uncertainty and stable data, the US dollar index rose about 0.8% on a weekly basis. Long-term concerns have not yet significantly impacted the market but are accumulating.
Labor Department data showed that initial unemployment claims for the week ending July 5 dropped to 227,000, a seven-week low, far better than the market's estimated 235,000. Strong data caused traders to again postpone bets on the first September rate cut, with FedWatch data showing the July rate cut probability dropped to 5.2% and September rate cut probability to 60.4%.
On July 2, Federal Reserve Chairman Powell emphasized at the European Central Bank's Sintra Forum that a July rate cut is possible but not officially supported, with uncertainties still existing about the second-round inflation impact of tariffs. Internal divisions are emerging at the Fed, with multiple officials "defecting" to support rate cuts, and this week the US Federal Housing Finance Agency director suddenly revealed that "Powell might resign".
Various signs indicate that the conflict between Trump and Powell regarding "rate cuts" is further deepening. However, the key point is whether tariffs will cause obvious inflation, which would directly affect September's rate cut. US stocks and BTC have already priced in September's rate cut. If inflation shows clear upward signals, the market will be under pressure and likely experience a certain degree of downward pricing, but this will not change the market trend.
Crypto Market
Macromarket uncertainties have caused US stocks to hover near historical highs, with the three major valuations slightly declining. However, benefiting from the double resonance of internal and external fund inflows, BTC rose 9.08% this week, creating a new historical high.
Technically, BTC's biggest achievement this week is breaking through the "Trump bottom" established since last November, which is the 90,000-110,000 USD oscillation range. BTC has oscillated in this range for 8 months, the third-largest consolidation platform in this bull market cycle, with over 30% of BTC experiencing on-chain movement in this range.
This range priced the major breakthrough of BTC and crypto assets being established as US strategic reserve assets during Trump's term, which is extremely significant. It also means the large-scale institutional adoption triggered by US public companies incorporating BTC into their treasury. We believe this range will be a very important new starting point.
Breaking through this range means BTC has officially launched the fourth wave of this bull market. In the June monthly report, we mentioned that, like the previous three waves, this rise will likely be completed quickly in a short time. This short time might be two to three months and is worth close attention.
BTC breaking through the 8-month "Trump bottom" oscillation has also activated the long intentions of other crypto assets, including ETH, bringing a market-wide rally.
Fund Inflows and Outflows
Amid the resurgence of the tariff war and global macro challenges, the robust internal and external fund inflows have pushed BTC to significantly outperform the Nasdaq and break through the "Trump bottom" this week.
This week, stablecoins and BTC Spot ETF channels totaled $5.886 billion, including $217.7 million in stablecoin channels and $2.78 billion in BTC Spot ETF channels. Additionally, the ETH Spot ETF channel also saw an inflow of $929 million, creating a single-week inflow record for this ETF type since its establishment.
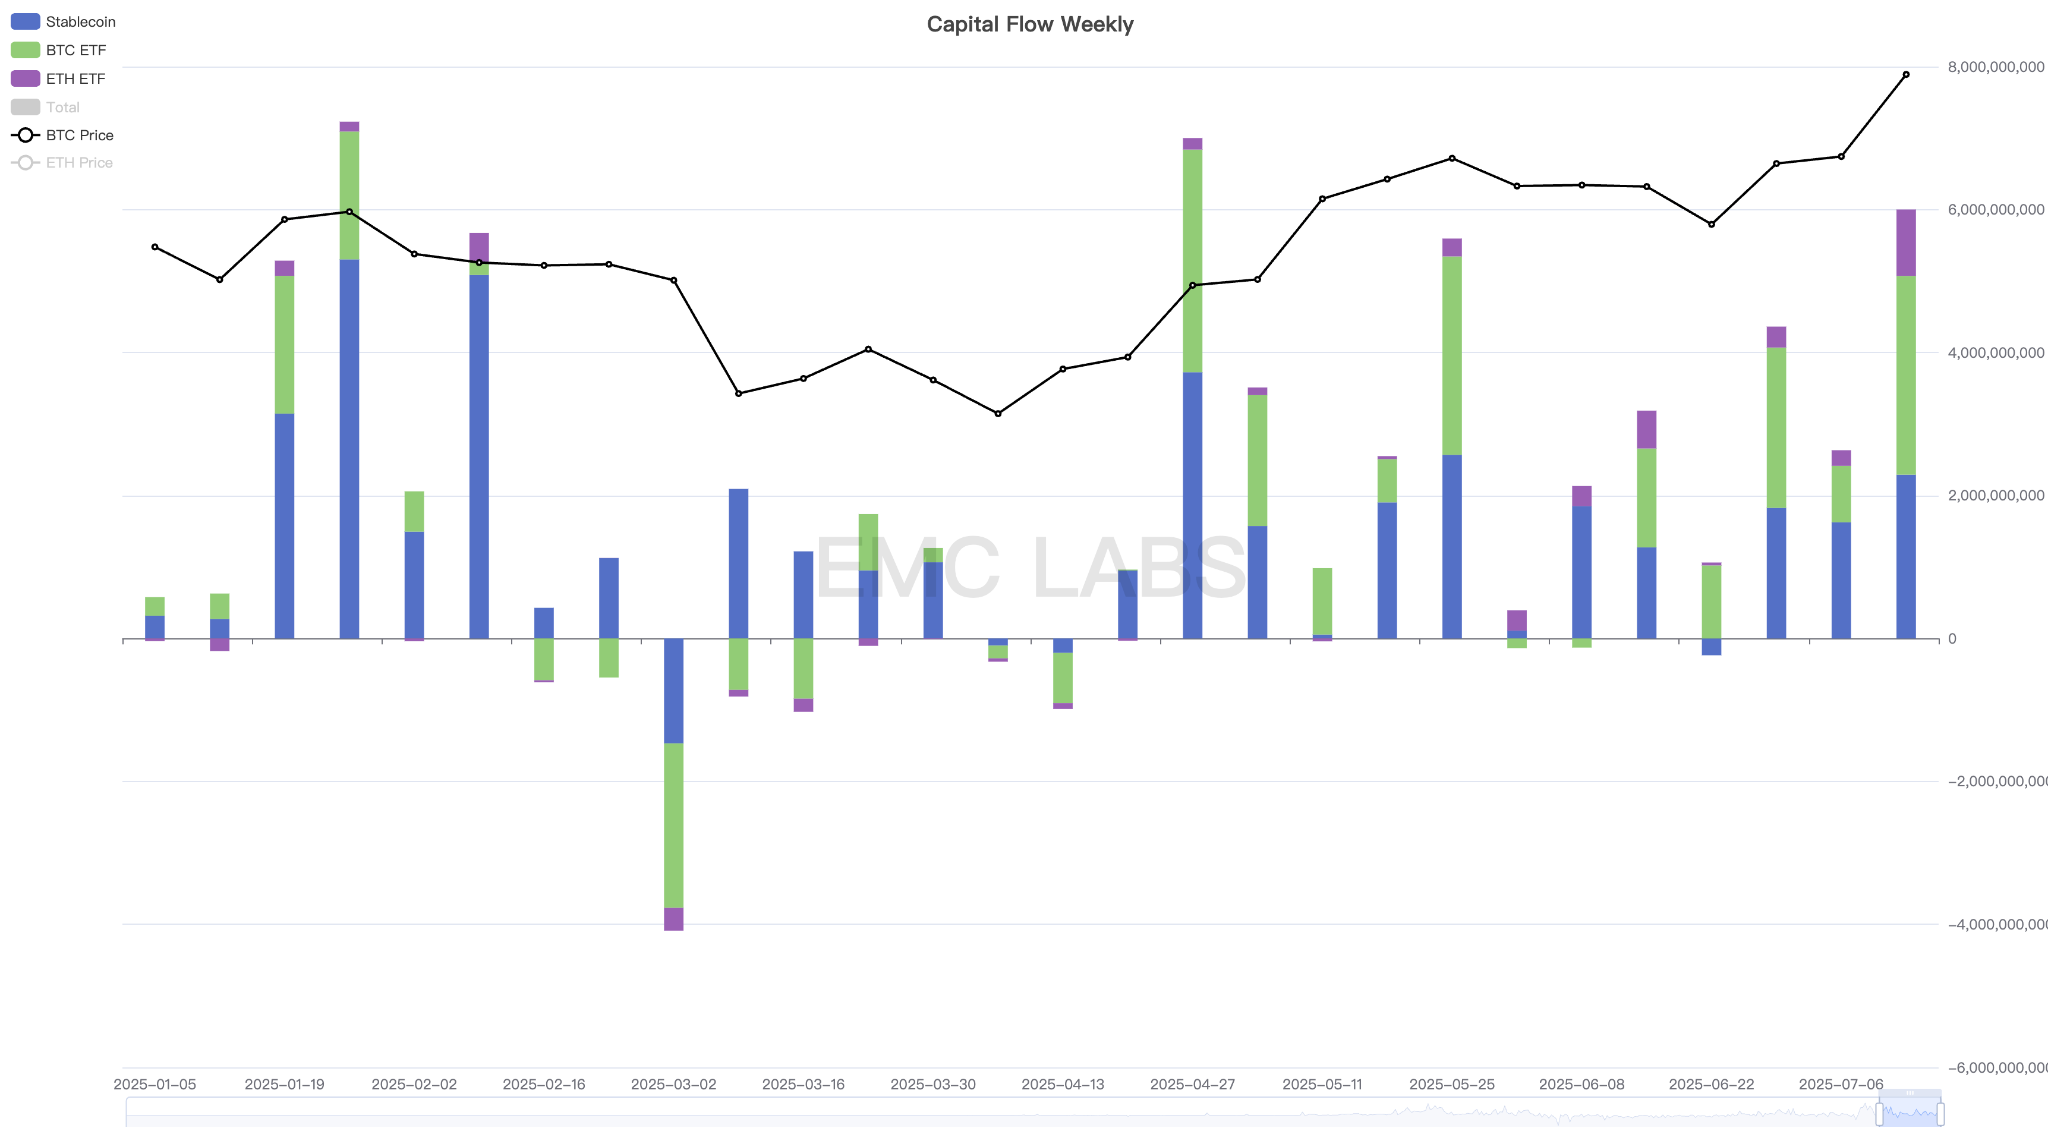
Stablecoin and BTC & ETH Spot ETF Fund Flow Statistics (Weekly)
Moreover, enterprise-level acquisitions are also accelerating.
Q3 market consensus is growing stronger, and the robust fund inflows are difficult to change the short-term trend, with the market regaining its bull market charm.
Selling Pressure and Sales
Since July, as BTC approaches its historical high again, long-term holders have started small-scale reductions. This week, with BTC breaking its historical high, long-term holder reductions have officially started, but the reduction amount is only slightly over 10,000 coins.
The selling scale of long and short-term holders has increased compared to last week, but the main selling pressure comes from short-term traders. Currently, short-term traders are about 18% in profit, and their selling power is gradually increasing but still limited. With strong buying power, exchanges remain in an overall outflow state.
We have repeatedly mentioned that long-term holder reductions signal the arrival of a new liquidity cycle. The September rate cut expectation remains unchanged, and forward-looking trading funds have a very strong willingness to price upwards. This is also why we cautiously remain optimistic about BTC's Q3 trend.
Cycle Indicators
According to eMerge Engine, the EMC BTC Cycle Metrics indicator is 0.625, in an upward phase.

EMC Labs (Emerging Laboratory) was established in April 2023 by crypto asset investors and data scientists. Focusing on blockchain industry research and crypto secondary market investment, with industrial foresight, insight, and data mining as core competencies, committed to participating in the booming blockchain industry through research and investment, and promoting blockchain and crypto assets to bring benefits to humanity.
For more information, please visit: https://www.emc.fund