Undoubtedly, this crypto bull market was first launched in the US stocks.
When the "crypto vault reserve strategy" becomes a trendsetter in US stocks, and crypto stocks are interconnected, how should we evaluate the quality of a stock? Is it by looking at who has a larger amount of reserved crypto assets, or who keeps buying crypto assets?
If you have been frequently analyzing crypto US stocks recently, you should have repeatedly seen a term - NAV, which stands for Net Asset Value.

Some use NAV to analyze whether crypto stocks are overvalued or undervalued, while others use NAV to compare the stock prices of a new crypto reserve company with MicroStrategy; and the more critical wealth code is:
If a publicly listed US stock company implements a crypto reserve strategy and holds 1 dollar of crypto, its value is greater than 1 dollar.
These crypto asset reserve companies can continue to increase their assets or buy back their own stocks, often causing their market value to far exceed their NAV (net asset value).
However, for ordinary investors, most projects in the crypto market are rarely evaluated with serious indicators, let alone used to evaluate the stock value in traditional capital markets.
Therefore, the editor also plans to do a popular science piece on the NAV indicator to help players focusing on crypto stock interconnection better understand the operating logic and evaluation methods of crypto stocks.
NAV: How much is your stock really worth?
Before delving into crypto US stocks, we need to first clarify a basic concept.
NAV is not an indicator specifically designed for the crypto market, but one of the most common methods in traditional financial analysis for measuring a company's value. Its essential function is to answer a simple question:
"How much is a company's stock per share really worth?"
The calculation of NAV is very straightforward, which is the value per share that shareholders can receive after the company's assets minus liabilities.

To better understand the core logic of NAV, we can use a traditional example. Suppose there is a real estate company with the following financial situation:
Assets: 10 buildings, total value of $1 billion; Liabilities: $200 million in loans; Total share capital: 100 million shares.
Then the company's net asset value per share would be: $80/share. This means that if the company liquidates its assets and pays off all debts, each shareholder theoretically can receive $80.
NAV is a very universal financial indicator, especially suitable for asset-driven companies, such as real estate companies, investment fund companies, etc. These companies usually have relatively transparent assets and easier valuation, so NAV can well reflect the intrinsic value of their stocks.
In traditional markets, investors usually compare NAV with the current market price of the stock to judge whether a stock is overvalued or undervalued:
If Stock Price > NAV: The stock may have a premium, and investors are confident about the company's future growth potential;
If Stock Price < NAV: The stock may be undervalued, the market lacks confidence in the company, or there are uncertainties in asset valuation.
When NAV is applied to crypto US stocks, its meaning undergoes some subtle changes.
In the crypto US stock field, the core function of NAV can be summarized as:
Measuring the impact of crypto assets held by a publicly listed company on its stock value.
This means NAV is no longer just the traditional "assets minus liabilities" formula, but needs to specially consider the value of crypto currency assets held by the company. The price fluctuations of these crypto assets will directly affect the company's NAV and indirectly affect its stock price.
For companies like MicroStrategy, the calculation of NAV will particularly emphasize the value of its BTC holdings, because this part of assets occupies the vast majority of the company's total assets.
So the previous calculation method is slightly extended:

When crypto assets are added to the NAV calculation, some changes you must consider are:
NAV's volatility increases dramatically: Due to the violent price fluctuations of crypto currencies, NAV is no longer as stable as traditional market real estate or fund assets.
NAV's value is "amplified" by crypto assets: Crypto assets usually obtain a premium in the market, which means investors are willing to pay a price higher than its book value to buy related stocks. For example, a company holding $100 million in BTC assets, but its stock price might reflect the market's expectation of BTC's future appreciation, causing the company's market value to reach $200 million.
When the market is bullish about BTC's future price, the company's NAV might be given additional premium by investors; conversely, when market sentiment is low, the reference value of NAV might decrease.
If you still don't understand NAV, let's take MicroStrategy as an example.

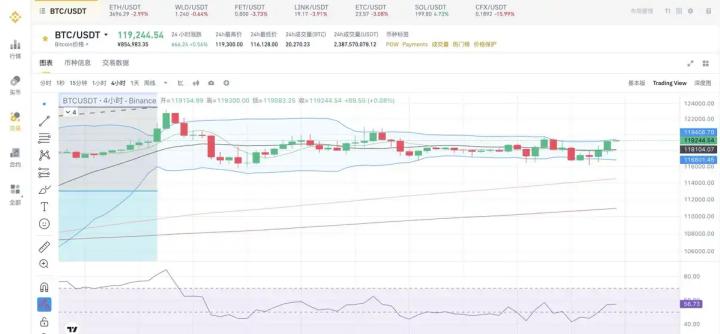
As of the time of publication (July 22), public data shows that MicroStrategy holds 607,770 BTC, priced at $117,903, with a total BTC asset value of around $72 billion, other assets around $100 million, and company liabilities of $8.2 billion.
With a total share capital of around 260 million, its NAV is calculated to be around $248/share. This means that with BTC as a crypto reserve, one share of MicroStrategy should be worth $248.
However, on the last US stock trading day, MicroStrategy's actual stock price was $426.
This reflects market premium, meaning if the market believes BTC will rise in the future, investors will factor this expectation into the stock price, making it higher than NAV.
This premium reflects that NAV cannot fully capture the market's optimistic expectations for crypto assets.
mNAV: A Sentiment Thermometer for Crypto US Stocks
Beyond NAV, you can often see analysts and KOLs talking about another similar indicator - mNAV.
If NAV is a basic indicator for measuring how much a stock is worth, then mNAV is an advanced tool more in line with the dynamics of the crypto market.
As mentioned earlier, NAV focuses on reflecting the current net asset status of the company (mostly crypto assets) without involving market expectations for these assets; while mNAV is a more market-oriented indicator used to measure the relationship between a company's market value and its crypto asset net value.

Here, "crypto asset net value" refers to the value of crypto currency assets held by the company minus related liabilities.
We can use a table to clearly compare the differences between the two indicators:

Following the previous calculation, MicroStrategy's total stock market value is around $120 billion, while the net value of its held BTC (crypto assets + other company assets - liabilities) is around $63.5 billion, so its mNAV is approximately 1.83.
This means MicroStrategy's market value is 1.83 times its BTC asset value.
Therefore, when a company holds a large amount of crypto currency assets, mNAV can better reveal market expectations for these assets, reflecting investors' premium or discount situation for the company's crypto assets; for example, in the above case, MicroStrategy's stock price is 1.83 times its crypto net assets.
For short-term investors focusing on market sentiment, mNAV is a more sensitive reference indicator:
When BTC price rises, investors may be more optimistic about the future performance of crypto asset-driven companies. This optimistic sentiment will be reflected through mNAV, causing the company's market price to be higher than its book value (NAV).
An mNAV above 1 indicates that the market values the company's crypto assets at a premium; an mNAV below 1 means the market lacks confidence in the company's crypto assets.
Premium, Reflexivity Flywheel, and Death Spiral
As mentioned earlier, MicroStrategy's current mNAV is around 1.83;
As ETH increasingly becomes an asset reserve for listed companies, understanding their mNAV can provide a certain reference for identifying whether the corresponding US stocks are overvalued or undervalued.
Analyst @Jadennn326eth from Cycle Trading has compiled a comprehensive table that intuitively shows the asset and liability situations and mNAV values of major ETH reserve companies (data as of last week).

From this ETH reserve company mNAV comparison chart, we can see the "wealth map" of crypto and stock linkage in 2025 at a glance:
BMNR tops the list with a 6.98x mNAV, with a market value far exceeding its ETH holdings value, but this may hide an overvaluation bubble - once ETH pulls back, the stock price will be the first to be damaged. BTCS, with only 1.53x mNAV, has a relatively low premium.
Since we've seen these companies' data, we must discuss the "Reflexivity Flywheel".
This concept originates from financial mogul Soros's reflexivity theory, which became the "secret engine" for these companies' stock price surge in the 2025 crypto and stock linkage bull market.
Simply put, the reflexivity flywheel is a positive feedback loop: the company first issues stocks or ATM financing to obtain cash and massively buy ETH; increased ETH holdings push up NAV and mNAV, attracting more investors, causing stock prices to soar; higher market value makes it easier for the company to refinance and continue accumulating ETH... thus forming a self-reinforcing, snowball-like flywheel effect.

However, once ETH prices pull back, regulations tighten (such as SEC's review of crypto reserve models), or financing costs surge, the ascending flywheel may reverse into a death spiral: stock price crash, mNAV plummets, and ultimately, stock market investors might be the ones hurt.
Finally, after reading this, you should understand:
NAV and other indicators are not a panacea, but tools in the toolbox.
When chasing crypto and stock linkage, players should rationally assess opportunities by combining Bitcoin/Ethereum's macro trends, company debt levels, and growth rates to find their own opportunities in a seemingly opportunity-filled but actually dangerous new cycle.