Pi Coin stabilizes around $0.47 after the "Buy Pi" announcement with legal tender has pushed the price to $0.52; this is the first real push in many days.
Two short-term technical signals suggest that this may not be the only upward bounce: trend strength has returned and a second medium moving signal is approaching.
Trend strength returns, but needs confirmation
Average Directional Index (ADX) on the 4-hour chart has returned above 30. This indicates that price movement has strength behind it, not just random emotion.
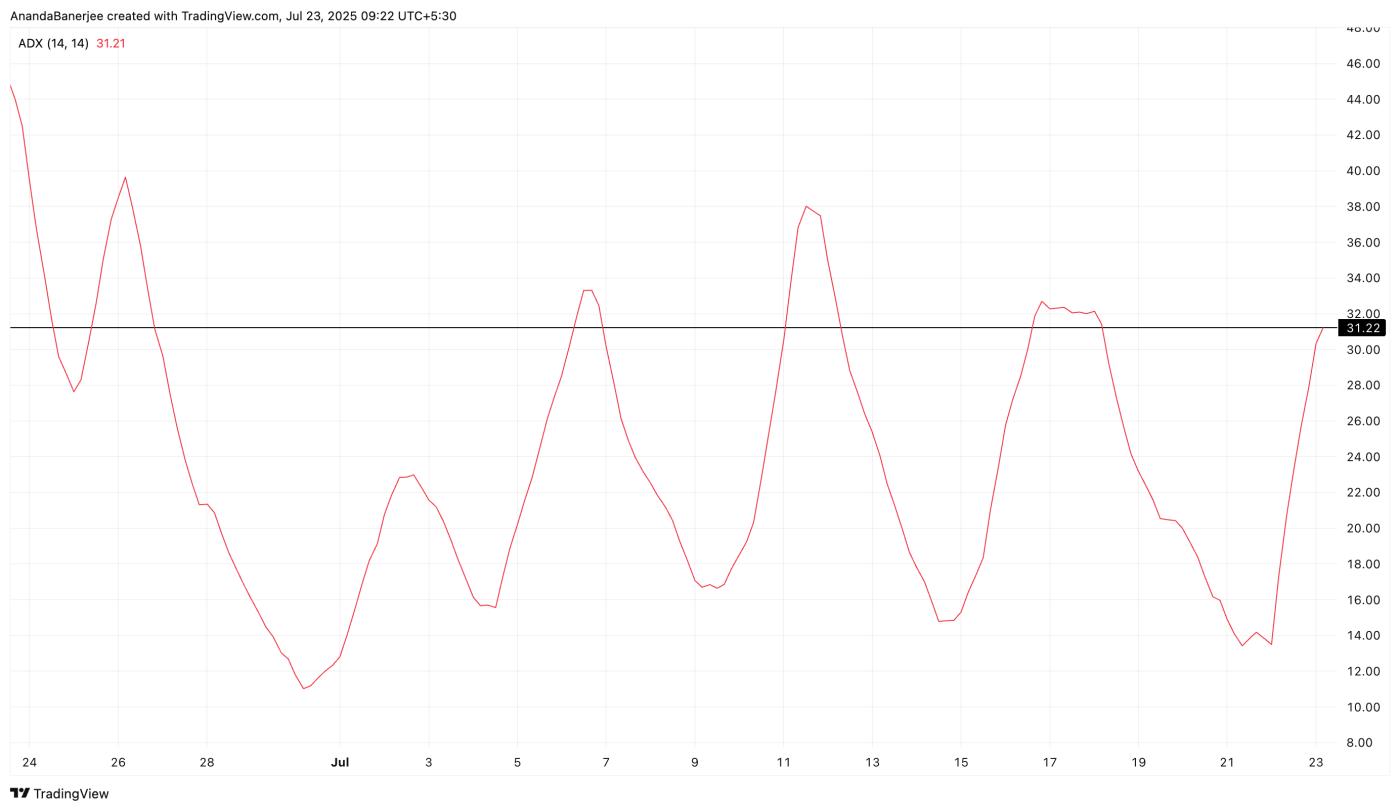 Pi Coin ADX Swings: TradingView
However, the current ADX peak is lower than the previous peak.
Simply put, Pi Coin's price trend exists, but is not stronger than the previous swing. A new ADX peak, or just maintaining ADX above the medium 20 level, will consolidate confidence.
The 4-hour timeframe is prioritized here because Tuesday's jump occurred during the day; signals appear there before the daily chart reacts.
ADX measures trend strength (from 0 to 100). It does not indicate an upward or downward trend, so it needs to be read with price action.
Want more information about such tokens? Subscribe to the Daily Crypto Newsletter by Editor Harsh Notariya here.
An EMA trigger still awaits
Exponential Moving Average (EMA) fast (20 periods) has crossed over the medium EMA (50 periods), which coincides with the movement from $0.45 to $0.52.
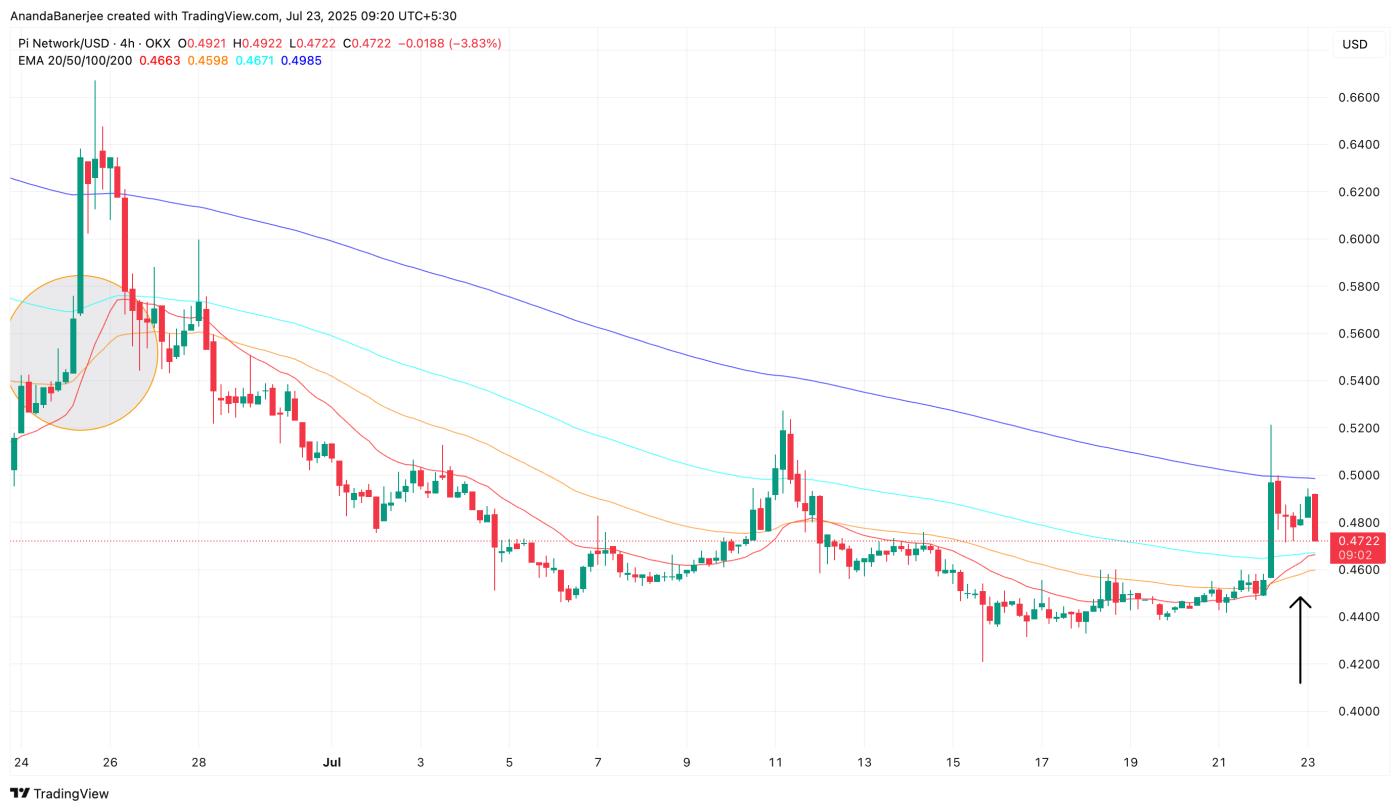 Pi Coin price and EMA crossover (4-hour chart): TradingView
A similar situation occurred at the end of June when the price rose from around $0.56 to $0.66. At that time, the fast EMA could not cross the slower EMA (100 periods), and Pi Coin's rally faded. The second crossover is now approaching, almost about to happen.
If this occurs this time while ADX remains stable, the possibility of a larger PI price rally will be improved.
The 200-period EMA (green line) on the 4-hour chart was briefly surpassed yesterday before encountering resistance. A clean close above it will match price structure with momentum.
EMAs evaluate recent prices more than old prices, so when shorter lines cross longer lines, it signals an increase in movement speed.
Important Pi Coin price levels to watch
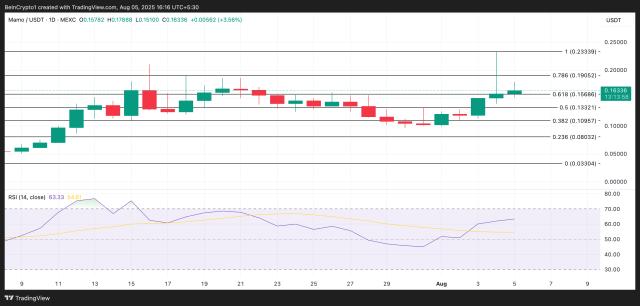
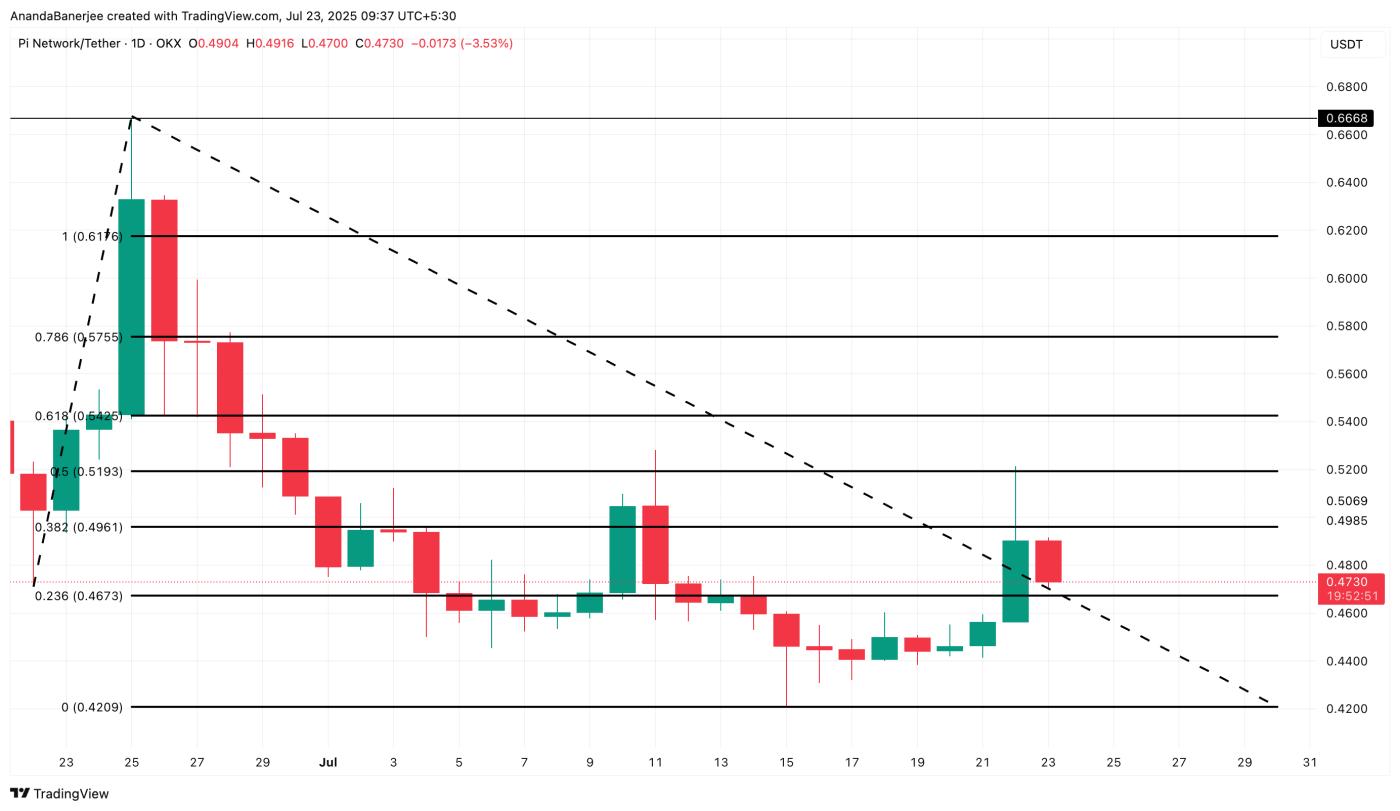
The daily chart sets the main levels for the larger picture. A Fibonacci extension based on the trend is used here. It connects three points: the late June Dip at $0.47, the swing peak near $0.66, and the mid-July Dump to $0.42.
 Pi Coin price analysis: TradingView
Tuesday's candle passed through three Fibonacci bands in one day: 0.236 at $0.46, 0.382 at $0.49, and 0.5 at $0.51. PI price is currently pausing in the range of $0.46–$0.49.
A daily close above that range opens the first level at $0.54 (0.618) and then $0.66, the previous swing peak, increasing about 40% from the current level if momentum continues and the expected EMA crossover finally occurs.
An inverse hammer price candle formed during the recovery (Tuesday's candle), indicating that buyers joined near the low.
Clear invalidation: a close below $0.46, ADX dropping below the medium 20 level, and the 20-period EMA failing to cross the 100-period line could bring Pi Coin price back to $0.42.