

Spark (SPK) price just surged over 90% in a day and reached a new All-Time-High of 0.121 USD on 23/07. The Ignition airdrop event continues to create excitement, but short-term charts are requesting another strong push before the price can continue rising.
Currently, the focus is on whether the supply will return to exchanges, whether the momentum will truly surpass the previous peak, and what the next support level will be. This is crucial for anyone tracking Spark price action or the broader Spark Token story.
Inflow to exchanges shows profit-taking risks are real
When a token nearly doubles in 24 hours, the first question is: Are investors starting to send coins to exchanges to sell? That's why the hourly net flow chart is important here.
SPK's net flow remained positive throughout the surge, meaning deposit volumes still outweigh withdrawals while the price is high.
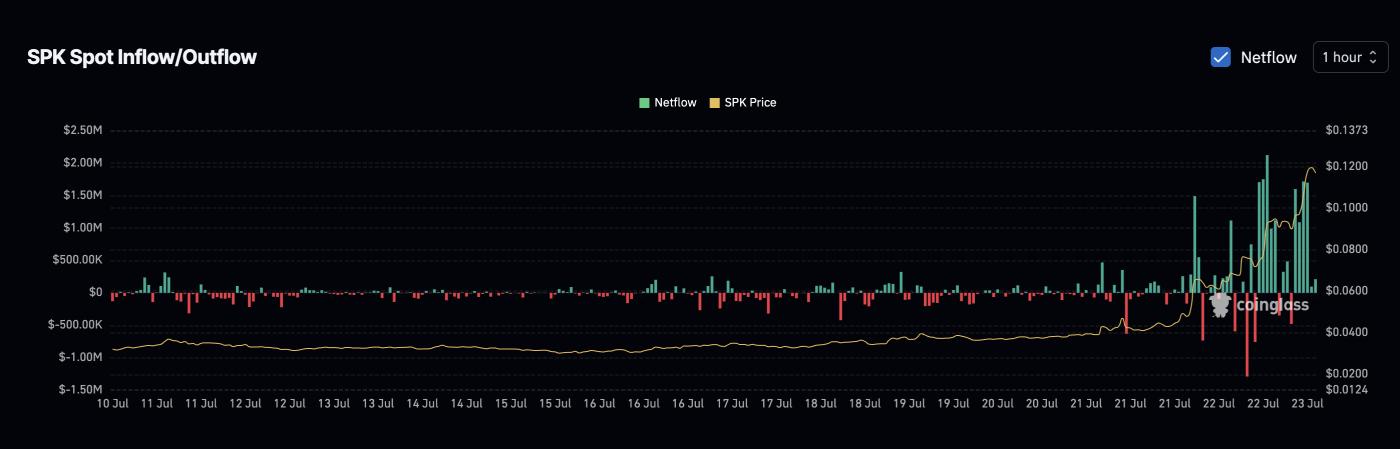 Spark price and positive net flow: Coinglass
The price has slightly decreased, so if inflow continues, additional coins on exchanges could quickly become sell orders.
Net flow simply tracks tokens moving in or out; continuous inflow while price stagnates often suggests a correction is coming, even during an uptrend.
RSI needs to lead for sustainable breakthrough
We analyze the 1-hour Relative Strength Index (RSI) because this movement is driven by news and momentum changing rapidly at that scale. Additionally, an hourly perspective can help predict any trends before moving to daily or even 4-hour timeframes.
Previously, between 21 and 22/07, RSI created a higher peak just as the price moved up, and that synchronization triggered a larger surge.
Currently, Spark price is closely tracking the top of an ascending wedge, but RSI is stuck around 80 without surpassing the previous peak. The price zone remains the same, but momentum is weaker.
To receive token analysis and market updates: Want more detailed information about such tokens? Subscribe to the Daily Crypto Newsletter by Editor Harsh Notariya here.
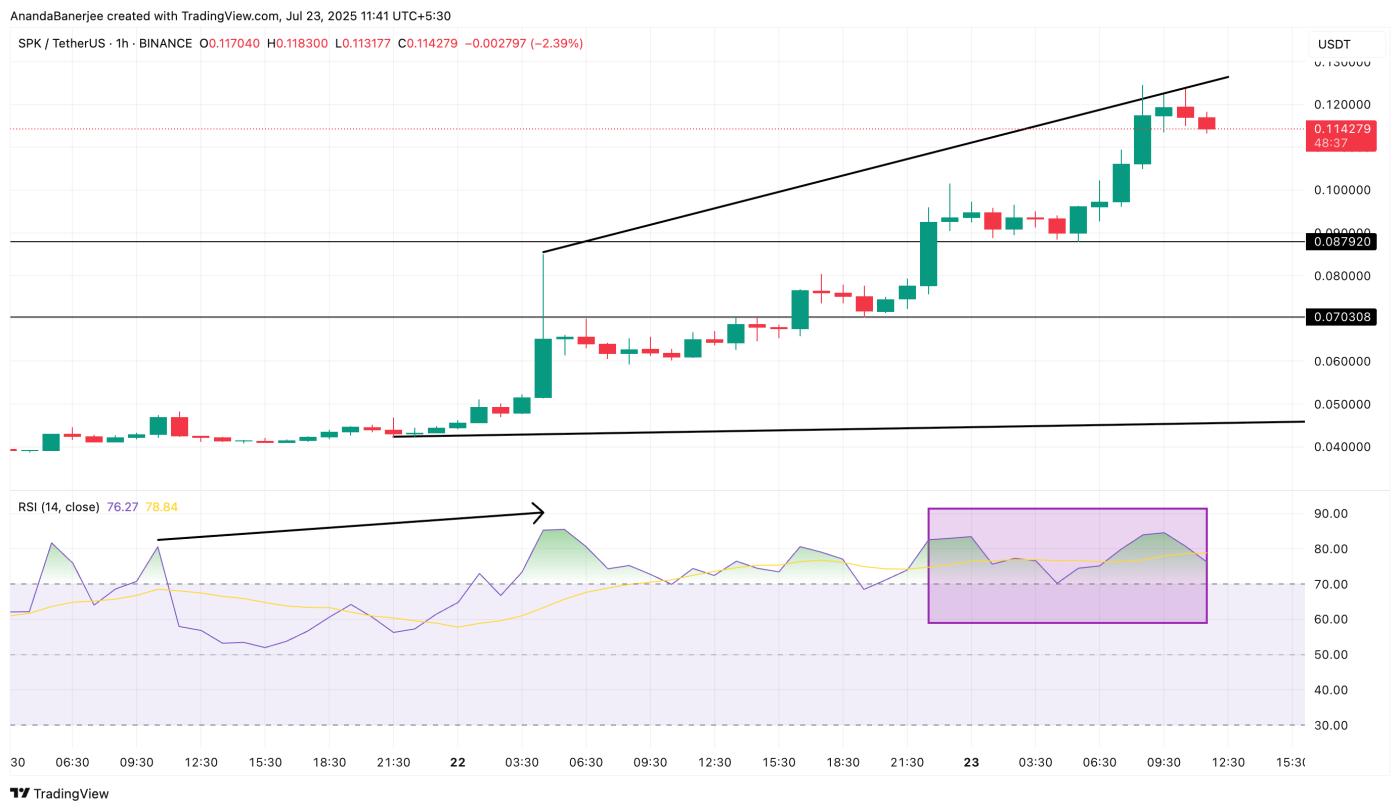 Spark price and RSI: TradingView
If RSI cannot create a higher peak with price, the likelihood of a price drop is higher.
RSI (Relative Strength Index) assesses recent movement strength from 0 to 100; when price moves sideways or increases but RSI decreases, momentum does not support the price push.
SPK Price Movement: 0.124 USD is the trigger point
The upper edge of that wedge almost completely matches the 0.618 level of a Fibonacci expansion based on the near trend of 0.124 USD, providing a clear confirmation level for Spark Token traders.
 Spark price analysis: TradingView
SPK failed there twice. It dropped from 0.117 USD to around 0.111 USD, so 0.110 USD is the first level buyers need to defend.
If lost, the price could move towards 0.101 USD, the previous swing high used to anchor Fibonacci.
Below that is 0.087 USD (0 Fib line). A broader ascending structure still exists in that area, but if SPK breaks below it, 0.070 USD will be considered and the uptrend will weaken.
On the other hand: a clear hourly close above 0.124 USD, with RSI rising higher and hourly inflow cooling down, will pave the way for continuation and a new All-Time-High in SPK price.


