#SHIB
- SHIB is trading above its 20-day MA, indicating short-term bullish momentum.
- MACD shows a slight bullish crossover, but the overall trend remains uncertain.
- Whale accumulation and market sentiment are mixed, with potential for volatility.
SHIB Price Prediction
SHIB Technical Analysis: Key Indicators to Watch
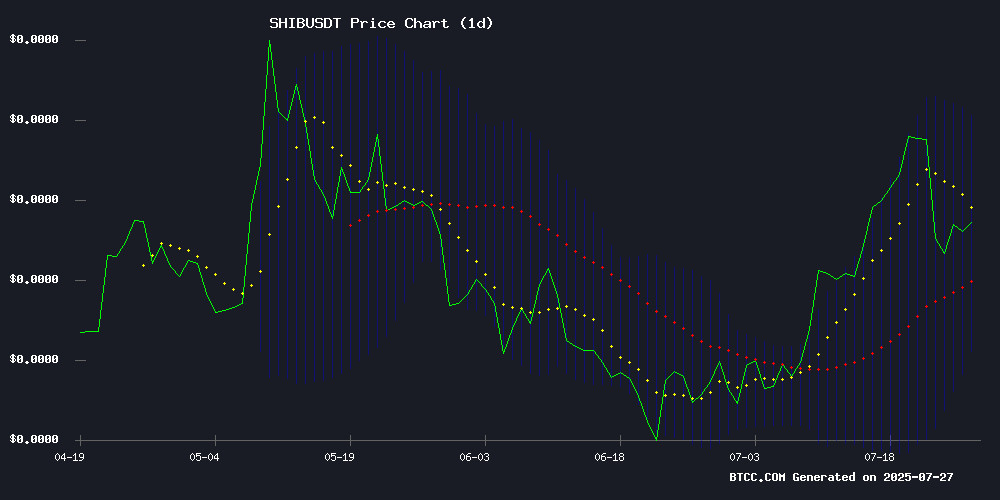
According to BTCC financial analyst James, SHIB is currently trading at 0.00001410 USDT, slightly above its 20-day moving average (MA) of 0.00001394. The MACD indicator shows a slight bullish crossover with a value of 0.00000020, suggesting potential upward momentum. However, the Bollinger Bands indicate that SHIB is trading near the middle band, with the upper band at 0.00001585 and the lower band at 0.00001203. This suggests a period of consolidation, with a breakout above the upper band potentially signaling a bullish trend.
SHIB Market Sentiment: Whale Activity Sparks Volatility
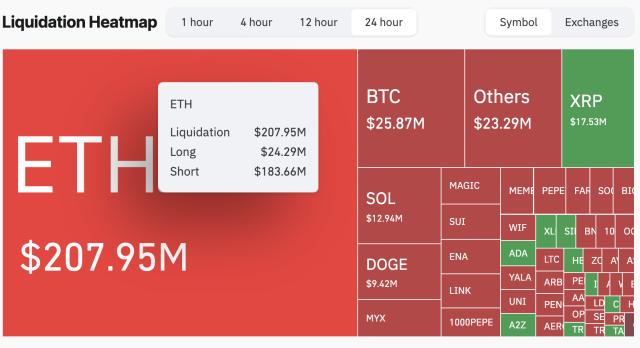
BTCC financial analyst James notes that recent news headlines highlight significant whale activity in the SHIB market, with 4.66 trillion SHIB being accumulated amid a 12% price crash. This accumulation phase has sparked speculation of a potential rebound, but the market remains cautious due to the massive Coinbase transfer that triggered the recent price drop. The sentiment is mixed, with some investors seeing this as a buying opportunity while others remain wary of further volatility.
Factors Influencing SHIB’s Price
Shiba Inu's Quiet Accumulation Phase Sparks Rebound Speculation
Shiba Inu's on-chain metrics suggest a period of quiet accumulation, with long-term holders showing resilience amidst market volatility. Exchange reserves have dipped slightly, signaling reduced sell pressure. The meme coin's ability to hold key support levels hints at potential upside if buying momentum returns.
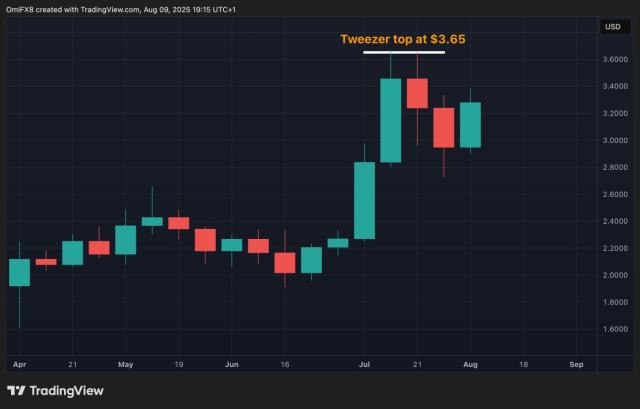
Santiment data reveals a 99.7% plunge in SHIB's Age Consumed metric since mid-June, indicating veteran investors are holding firm. This contrasts sharply with May's price tops, when older wallets actively participated in rallies. The current dormancy suggests stronger conviction among legacy holders.
Exchange outflows totaling 200 billion tokens between July 22-25 further support the accumulation thesis. With fewer coins available for immediate sale and long-term holders staying put, SHIB's path to reclaiming $0.000015 appears increasingly plausible if market conditions cooperate.
Shiba Inu Price Crashes 12% Amid Whale Accumulation of 4.66 Trillion SHIB
Shiba Inu's price plummeted 12% in recent trading sessions, sparking widespread attention across crypto markets. The meme coin dropped from $0.000015189 to $0.000014130, outperforming Dogecoin's 8.5% decline during the same period. Despite the sell-off, whale investors seized the opportunity to accumulate 4.66 trillion SHIB tokens, signaling institutional confidence remains intact.
Trading volume surged to 4.33 trillion tokens, far exceeding typical levels. Meanwhile, Shiba Inu's burn rate collapsed by over 95%, raising questions about the sustainability of its deflationary model. The token tested critical support at $0.000014060 as retail investors panicked—precisely when whales chose to buy aggressively.
Shiba Inu Price Crash: Massive Coinbase Transfer Sparks Speculation
A staggering transfer of 5 trillion SHIB tokens, valued at approximately $69.98 million, has ignited intense speculation across the cryptocurrency market. The tokens were moved from Coinbase to an unknown wallet, as reported by Whale Alert. This transaction follows a sharp 7% decline in Shiba Inu's price, now trading at $0.000014.
Market participants are divided on the implications. Some interpret the whale's MOVE as a precursor to further selling pressure, while others suggest the tokens may have been withdrawn for strategic holding. The timing amplifies uncertainty, coming on the heels of a price crash that erased weeks of gains for the meme coin.
Will SHIB Price Hit 1?
According to BTCC financial analyst James, the likelihood of SHIB reaching 1 USDT in the near future is extremely low given its current price of 0.00001410 USDT. The technical indicators suggest a period of consolidation, and while whale activity may indicate accumulation, the sheer scale of SHIB's circulating supply makes such a price target unrealistic without significant fundamental changes. Below is a summary of key data points:
| Indicator | Value |
|---|---|
| Current Price | 0.00001410 USDT |
| 20-day MA | 0.00001394 USDT |
| MACD | 0.00000020 |
| Bollinger Bands (Upper) | 0.00001585 USDT |
| Bollinger Bands (Lower) | 0.00001203 USDT |