

BNB has strongly increased to a new All-Time-High of 858 USD just a few days ago, but currently this coin is fluctuating around 800 USD, decreasing nearly 7% in the past 24 hours. This rapid reversal makes traders question whether a new All-Time-High for BNB is near, or sellers have tightened control.
On-chain data shows medium-term holders are selling, buying momentum is losing and early price decline signs are appearing on shorter timeframes. Currently, the price increase seems vulnerable and a push to new highs may require waiting.
Medium-term investors retreat, slowing momentum
When coins are held for 6-12 months, this group typically plays a stable role, helping maintain the trend. But in the past three days, the HODL wave of this group has sharply decreased, from 72.65% of supply on 07/27 to just 65.88% at the time of writing.
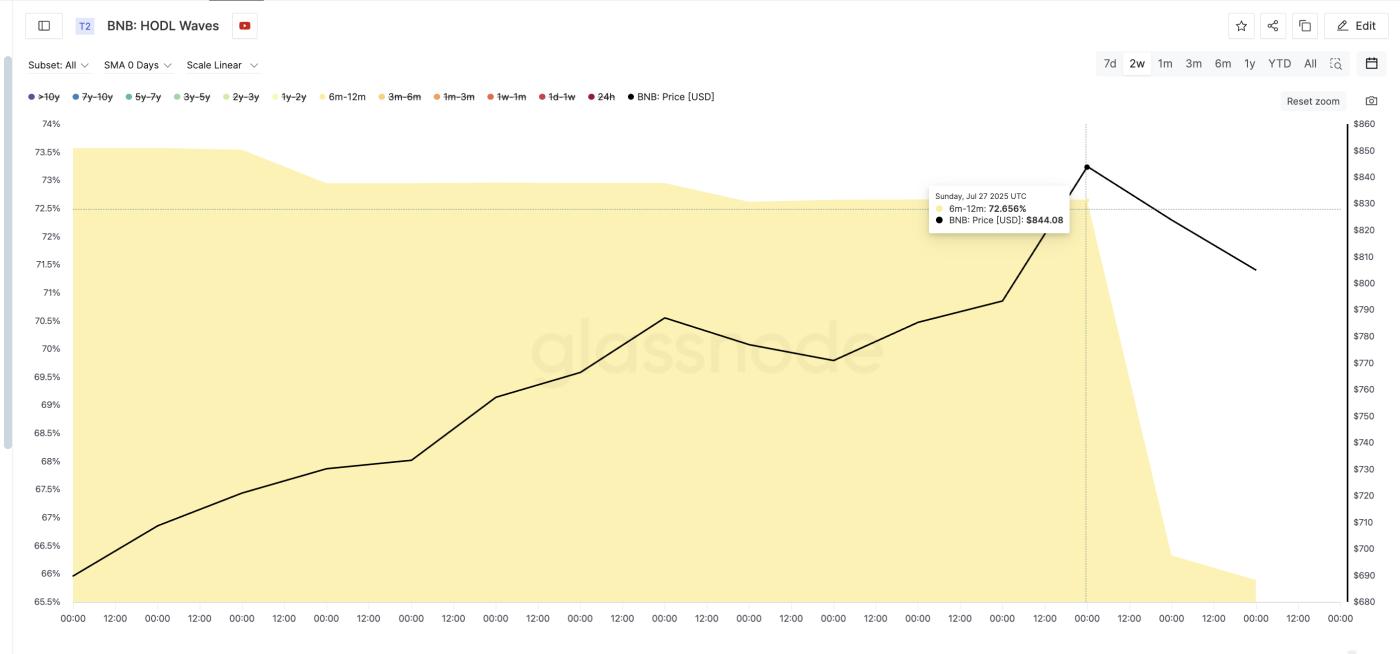 BNB Price and Narrowing HODL Wave: glassnode
This change is notable because it shows medium-term holders are distributing, taking profits after the record peak. With fewer trusted wallets holding supply, there is less buffer against selling pressure, making it difficult for BNB to clearly advance to a new All-Time-High.
The HODL wave tracks the time coins remain in wallets. A narrowing wave in the medium-term typically signals weakening market confidence.
For TA and token market updates: Want more detailed information about such tokens? Subscribe to the Daily Crypto Newsletter by Editor Harsh Notariya here.
OBV momentum weakens, early price decline signals form
On-Balance Volume (OBV) on the daily timeframe is printing lower peaks, indicating buying pressure is not keeping up with price efforts near 800 USD. Weakening OBV after an All-Time-High often indicates price increases are losing depth, with fewer buyers participating to push the movement further.
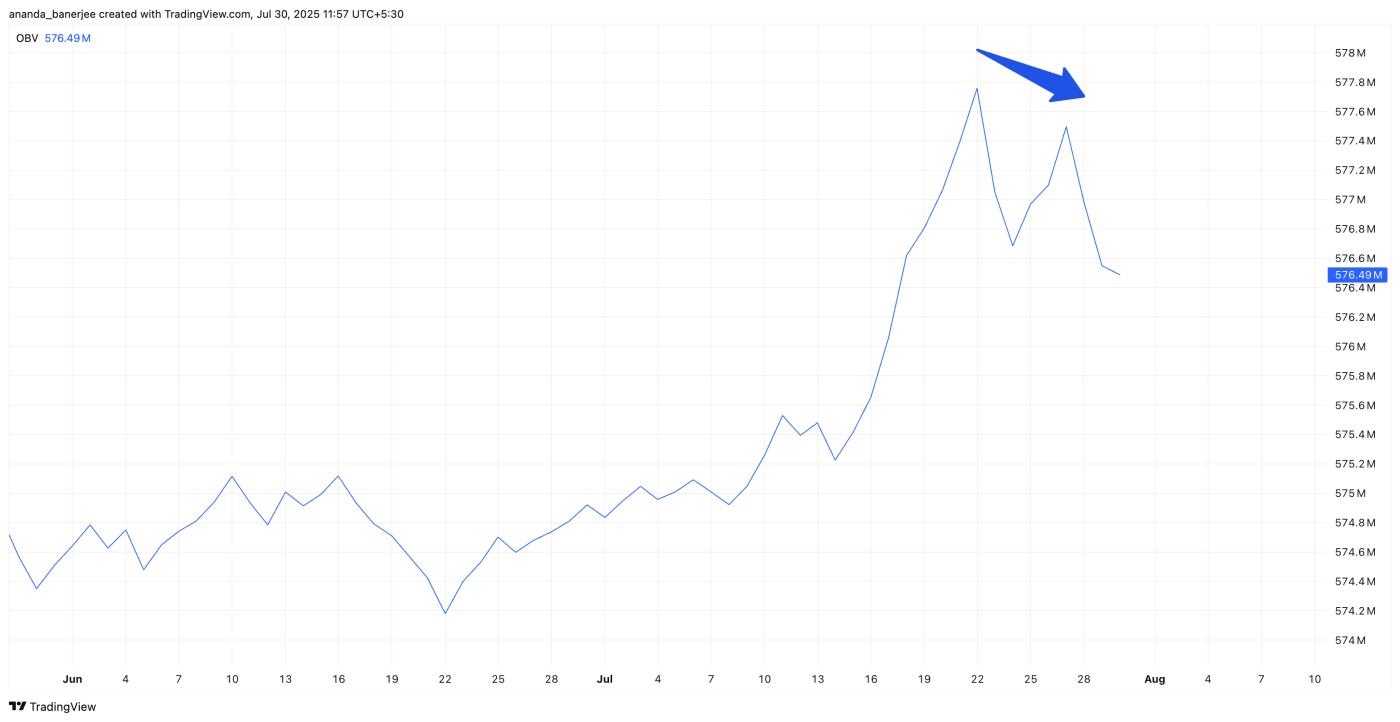 Weakening On-Balance Volume: TradingView
To confirm this, the 2-hour chart, an early momentum timeframe, shows the 20-period Exponential Moving Average (red line) is converging towards a bearish crossover below the 50-period EMA (orange line).
This setup typically appears before broader trend reversals, emerging on shorter timeframes before the daily chart reflects weakness. BNB price could further adjust if a bearish "death" crossover occurs.
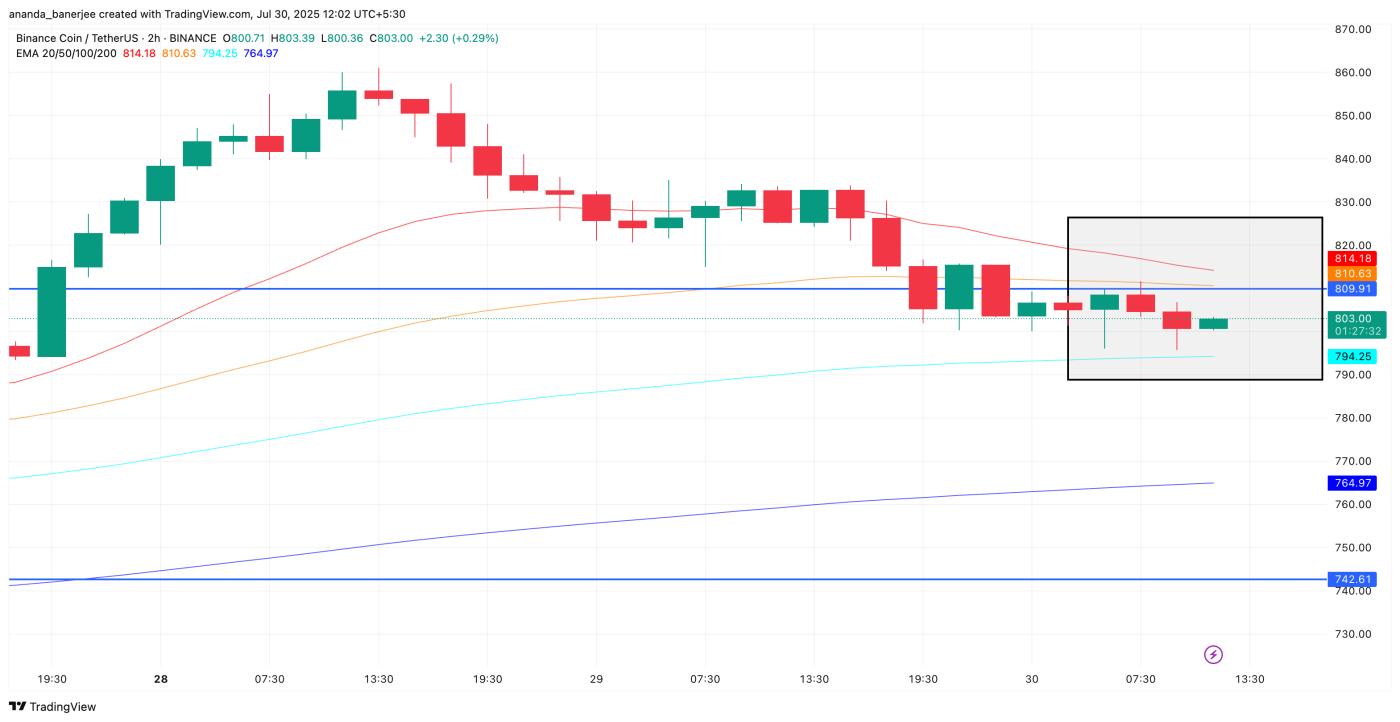 BNB Price Action and Upcoming Crossover Risk: TradingView
Combined, the narrowing HODL wave and declining OBV suggest the recent ATH excitement is quickly fading, leaving BNB vulnerable to further decline before a potential new breakout emerges.
OBV measures accumulated trading volume flow — when it tends to decrease while price remains steady, it typically signals weakening demand.
BNB Price Levels: Bulls Need to Reclaim Key Zones
The broader BNB trend remains intact, which is why Fibonacci expansion levels based on the trend are used instead of regression. They outline the extent to which the price increase could extend if momentum returns.
 BNB Price Analysis: TradingView
Currently, the price is facing:
- Resistance: 822 USD remains a solid ceiling. Breaking it will open possibilities to retest the All-Time-High, with potential expansion to 871 USD.
- Support: 791 USD is holding firm. If broken, likely to drop to 742 USD (nearly 7% lower) with little support below.
Bulls must reclaim 871 USD, turning it into support, to eliminate the short-term decline setup and reignite hopes of reaching a new All-Time-High.
BNB's strong retreat from the record high does not kill the larger upward trend, but with medium-term holders selling, decreasing volume, and price decline signals appearing on shorter timeframes, a new All-Time-High might take time to emerge.


