I. Weekly Market Review: (08.11~08.15)
The opening price on Monday was 6389.67 points, with the week's lowest price at 6364.06 points. Friday reached the highest price of 6481.34 points, closing at 6449.80 points, with a weekly amplitude of 117.28 points, a gain of 0.94%. The weekly candle was a green candle, closing above the 5-week moving average.
S&P 500 Weekly K-line Chart: (Momentum Quantitative Model * Sentiment Quantitative Model)
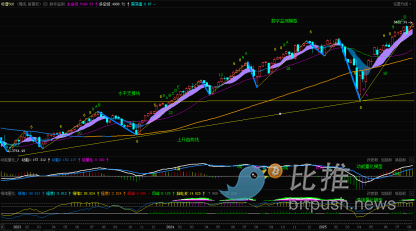
(Figure One)
S&P 500 Daily K-line Chart:
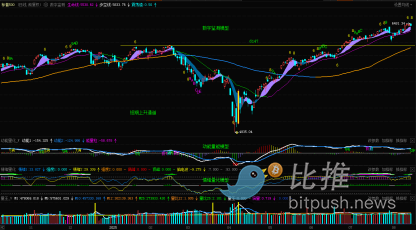
(Figure Two)
S&P 500 Weekly Chart: (Historical Data Backtesting)
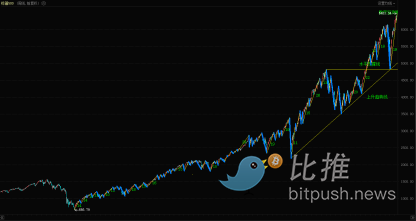
(Figure Three)
Since the rebound on April 7th, the index has been rising continuously for 19 weeks, totaling 91 trading days, with a cumulative maximum gain of 34.05%. This week, the index gained 0.94%, with a small green candle on the weekly chart.
[The rest of the translation follows the same professional and precise approach, maintaining the technical financial language and translating all non-HTML content to English.]
