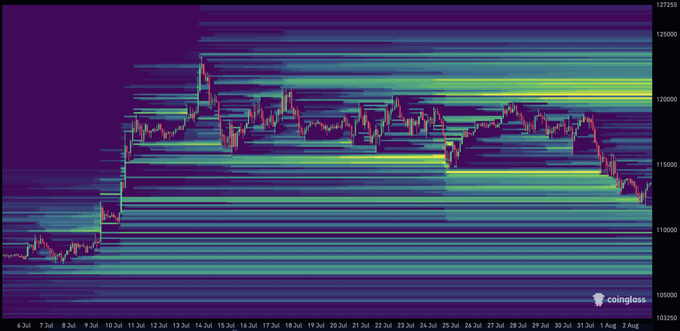
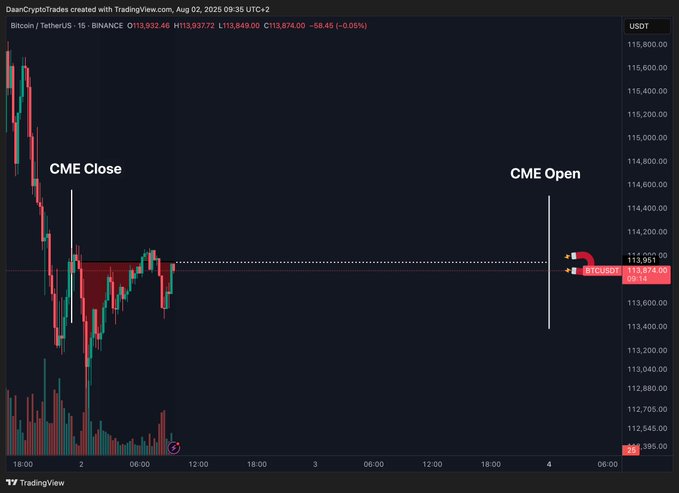
$BTC Interesting liquidity heatmap.
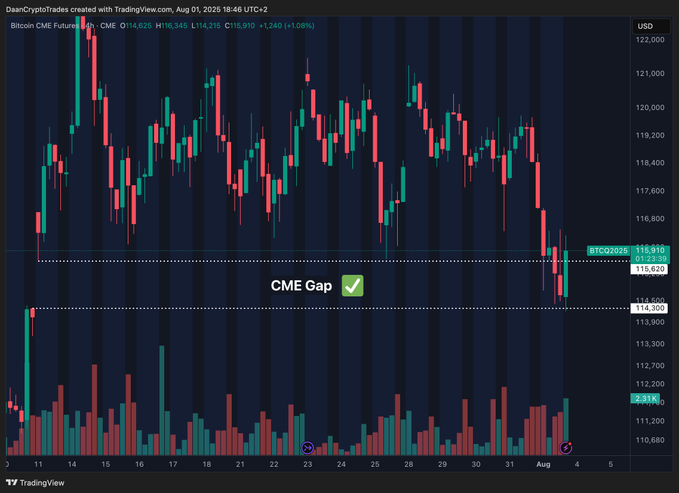
Took out all the large clusters below the $115K area which was the range low for a few weeks.
Pretty much nothing right above until that $120K level where a ton of liquidity sits.
Safe to assume that if price gets there, it will have the fuel to accelerate to new highs.
But until then, we are in a short term down trend which BTC will need to break. Above $115K would be a good start in the short term. $110K-$112K remains a key support.