

The Pi Network (PI) has surged more than 70% in the last 24 hours, with a market capitalization of $16 billion and a trading volume of over $2.3 billion.
Despite reaching a new all-time high of nearly $3, this technical divergence suggests that PI's volatility is on a significant path. Traders are closely watching how the token moves between the bullish momentum that could push it towards $4 and the warning signals that it could drop to $1.7 or even $0.79.
Pi Network DMI, Strongly Bullish
The Directional Movement Index (DMI) of the Pi Network is showing remarkable momentum, with the Average Directional Index (ADX) surging from 12.3 a day ago to 57.7.
ADX is a key technical indicator that measures the strength of a trend, regardless of its direction. Readings below 20 indicate a weak trend, 20-40 a moderate trend, and above 40 a strong trend.
The fact that Pi's ADX has spiked from the weak to the very strong area indicates that the underlying trend strength has significantly strengthened.
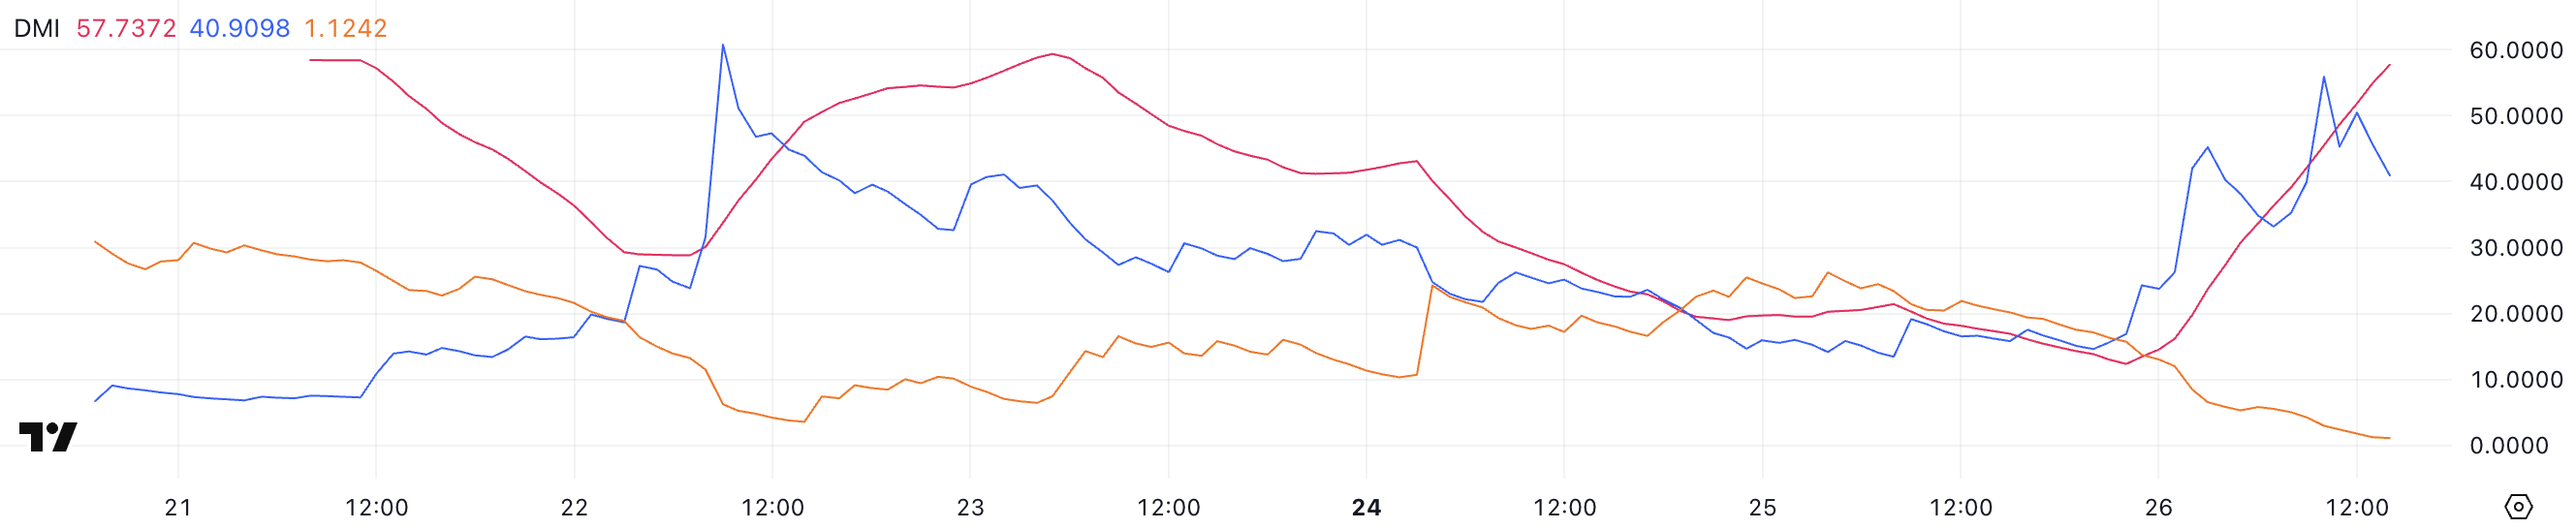
Complementing this ADX surge, Pi's Positive Directional Indicator (+DI) has skyrocketed from 14.6 two days ago to 40.9, while the Negative Directional Indicator (-DI) has plummeted from 19.4 to 1.1 over the same period.
When +DI is significantly higher than -DI, as is the case with Pi currently, it confirms a strong bullish trend. The high ADX value and the large gap between +DI and -DI suggest that the Pi Network is experiencing an exceptionally strong uptrend, with very little selling pressure.
If these technical signals maintain their current configuration, it could indicate that Pi's price can continue to rise in the short term, with the market under strong buying control and little resistance.
PI BBTrend, Negative Despite Price Surge
Despite the continued price surge, Pi's Bollinger Band Trend (BBTrend) indicator has plummeted to -11, a dramatic drop from 51.2 three days ago and the 1-3 range it was hovering around yesterday.
The BBTrend indicator is a specialized technical tool that measures the price movement within the Bollinger Bands. It essentially quantifies how the price is trending within these volatility-based channels.
Positive values indicate an upward price movement within the bands, while negative values suggest a downward movement or a reversion towards the middle band.
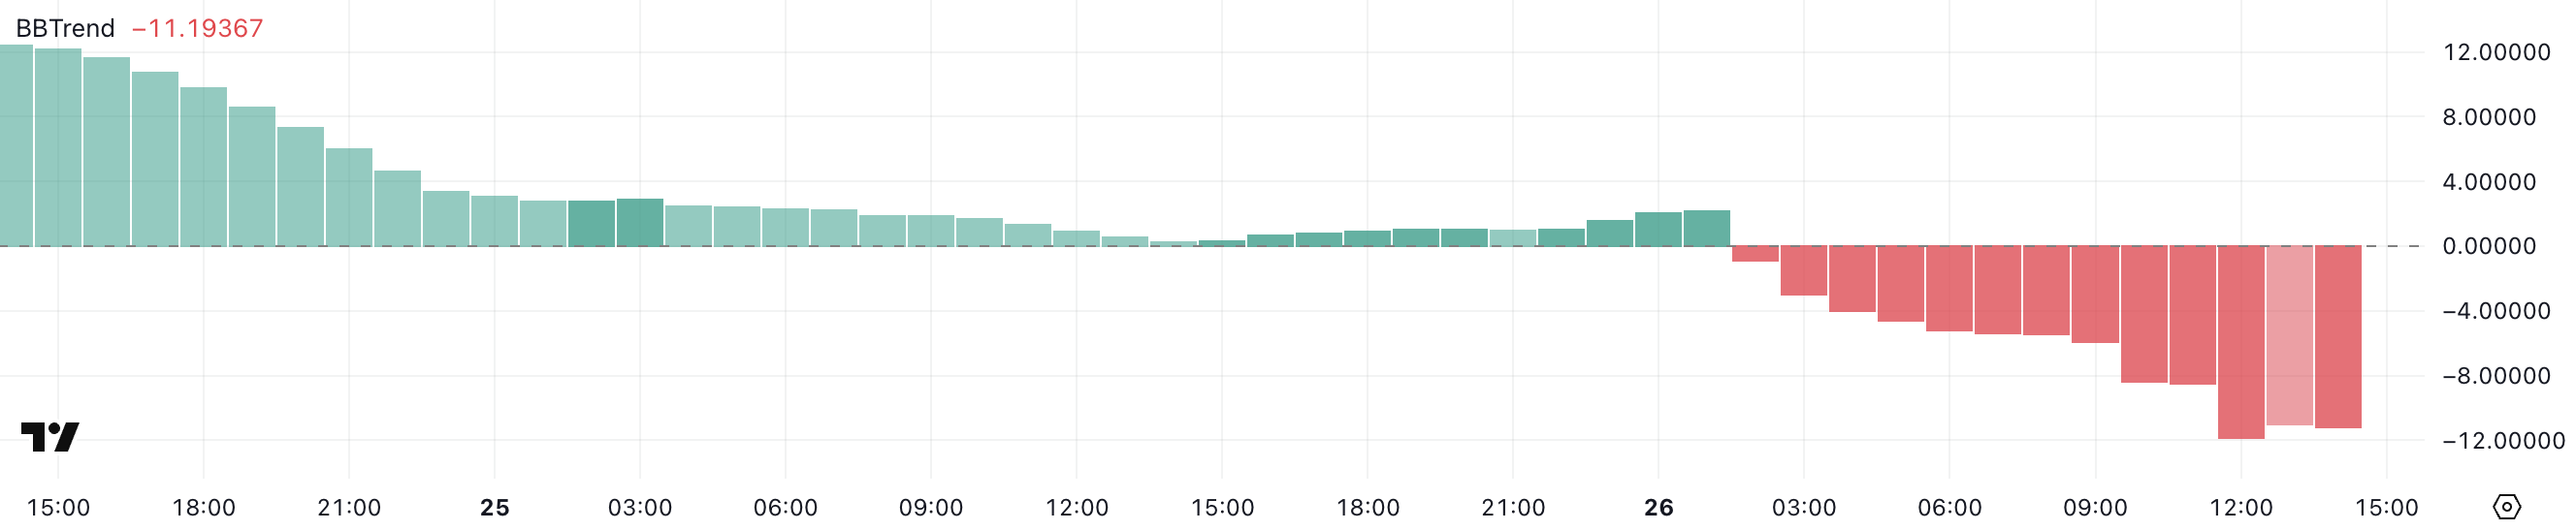
The fact that Pi's BBTrend has plummeted to -11 suggests that the current uptrend may be considerably overbought and could be due for a correction or a period of consolidation.
When the BBTrend turns significantly negative after a price surge, it often indicates that the asset has moved too quickly and is trading at unsustainable levels in the short term.
This technical warning signal suggests that Pi may experience a correction towards the middle Bollinger Band, go through a sideways consolidation period, or at the very least, see a slowdown in its upward momentum.
Will Pi Network Reach $4 in March?
The Pi Network price has reached a new all-time high, approaching $3 just a few hours ago.
This strong bullish momentum has allowed Pi to break through the psychological $3 barrier, and it may be able to test higher resistance levels of $3.5 or even $4 in the short term.
This impressive rally shows that market interest and buying pressure are increasing, and if the positive sentiment persists, it could maintain additional upside.
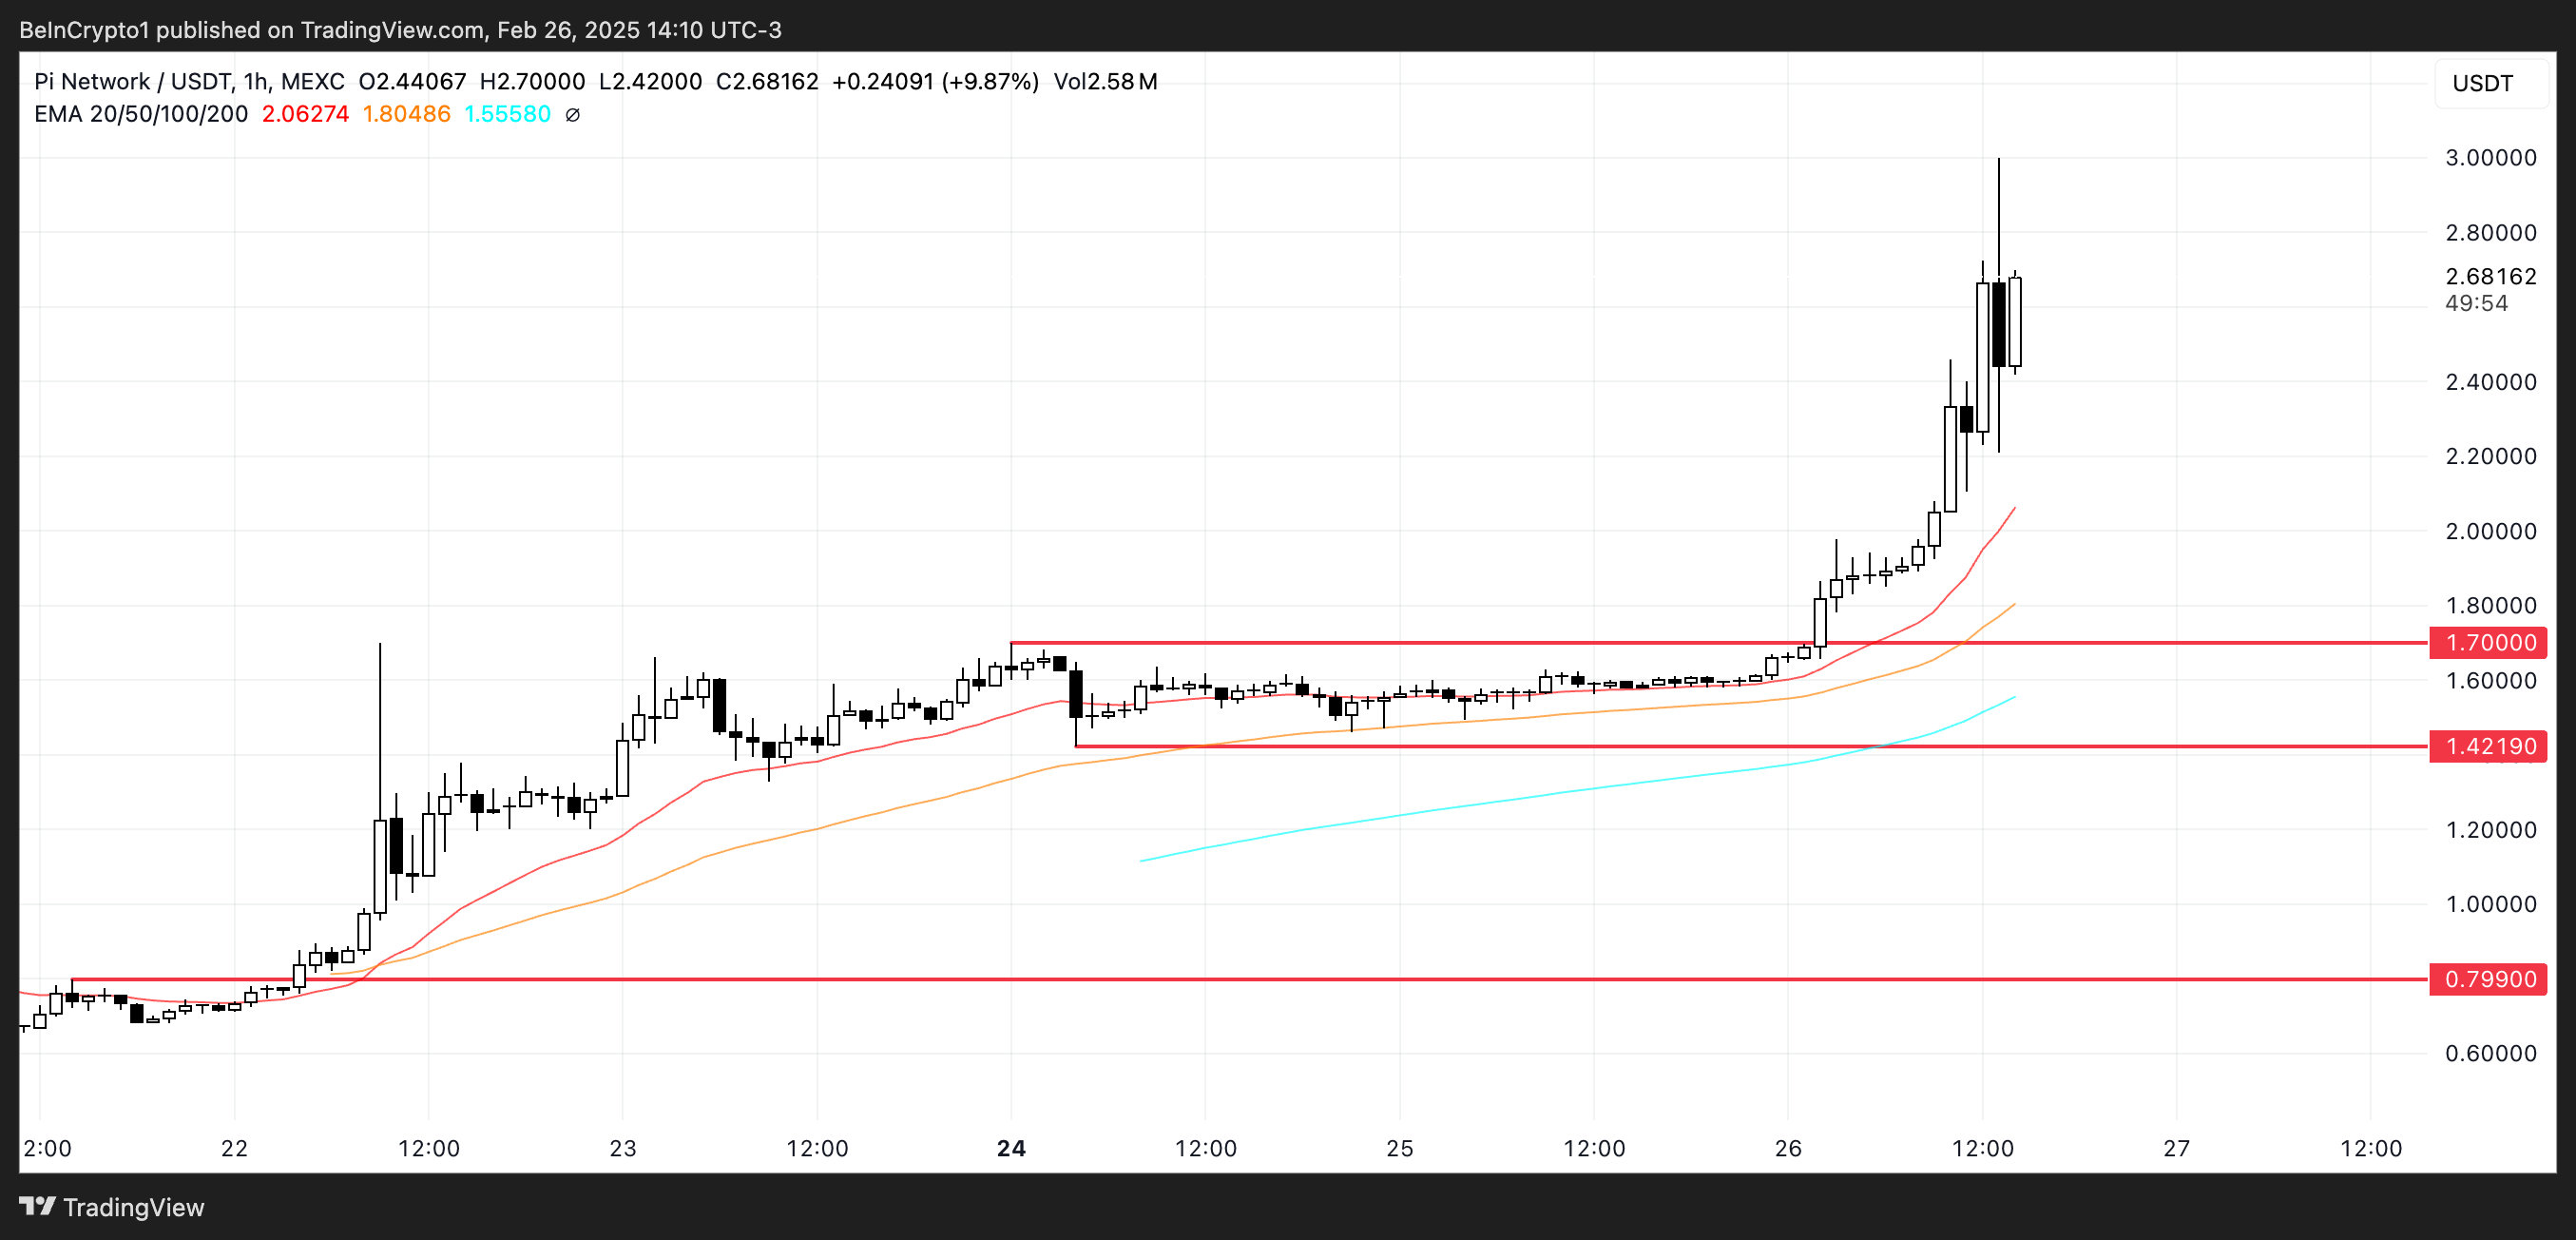
However, as suggested by the negative BBTrend reading, this rally may be overbought and at risk of a reversal. If the bearish technical signals manifest in the price action, Pi could experience a significant correction, initially testing the $1.7 support level.
If this level is not maintained, the selling pressure could intensify, leading to a further drop to as low as $1.42.
In the event of a sustained downtrend, Pi's price could experience a more dramatic decline to $0.79, which would represent a substantial retracement from the current highs within just 5 days.


