

Stellar (XLM) has risen more than 10% in the last 24 hours and is attempting to recover from a 15% correction over the past month. Despite this rebound, XLM's trend is at a critical point, with a current market capitalization of $8.6 billion.
Technical indicators show a significant increase in buying pressure, with both the DMI and CMF indicating accumulation. However, XLM is still facing a major resistance level, and its ability to maintain this momentum will determine whether the price can break above $0.35 or if it will undergo further correction.
XLM Chart, Buyer-Driven
According to Stellar's DMI chart, the Average Directional Index (ADX) has declined from 35.6 two days ago to 28.7, indicating that the strength of the trend, regardless of direction, is weakening. An ADX above 25 signals a strong trend, while below 20 indicates a weak or corrective market.
The decline in ADX from 35.6 to 28.7 suggests that Stellar's downtrend is weakening and creating an opportunity for a momentum shift.
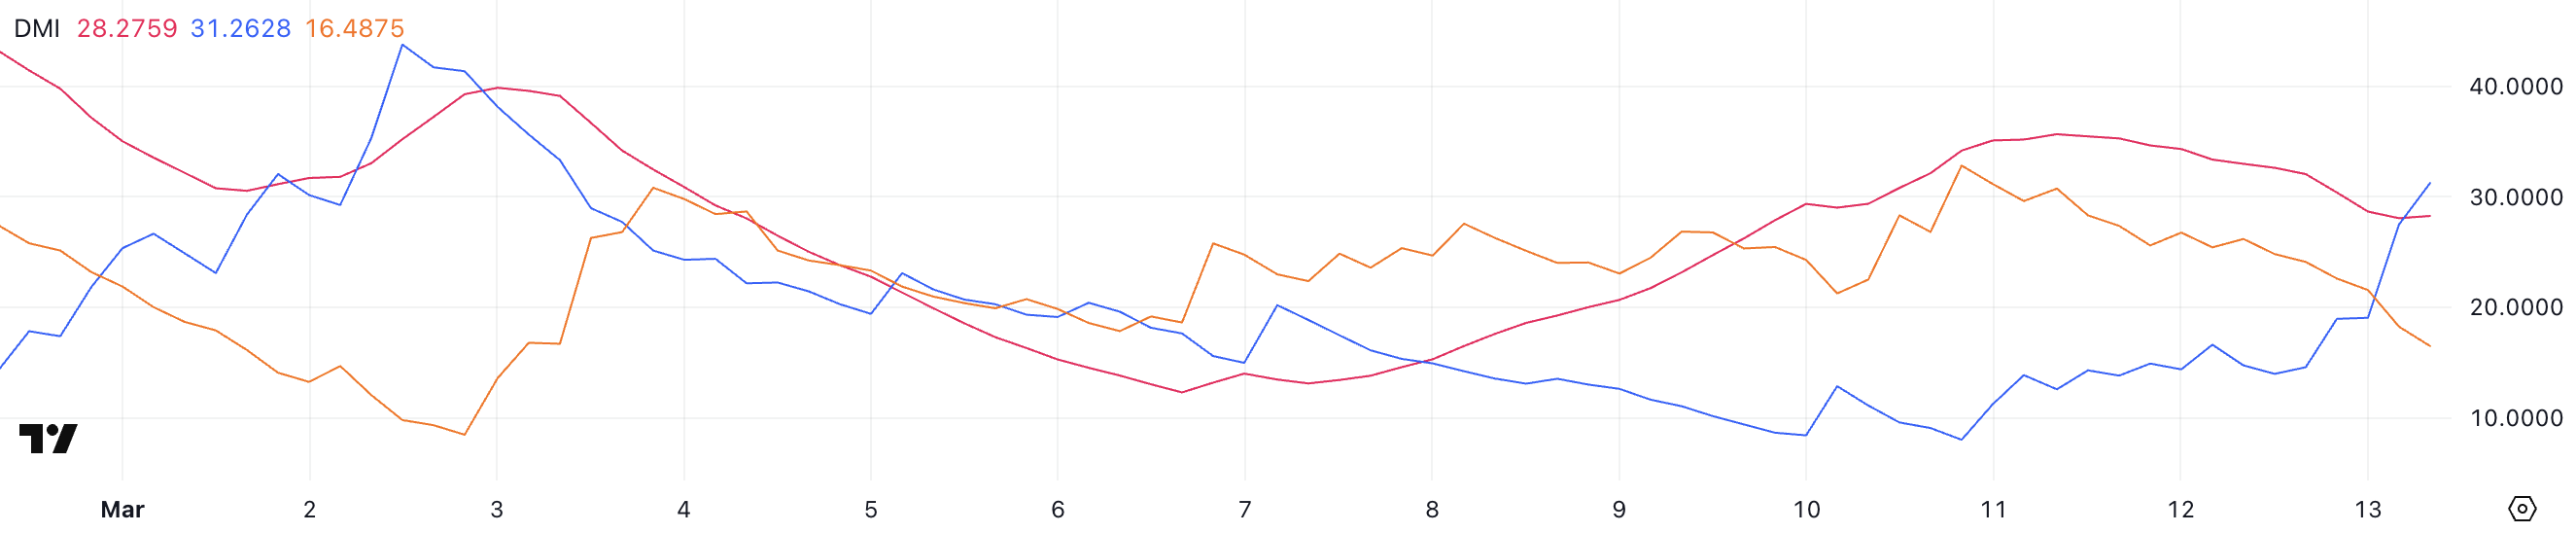
The directional indicators show that +DI has surged from 8 to 31.2, while -DI has declined from 30.7 to 16.4. This significant change in buying and selling pressure suggests that the buying force has regained control after a strong sell-off.
In the context of Stellar attempting to transition from a downtrend to an uptrend, the increase in +DI is a positive signal. However, for the new trend to strengthen, the ADX needs to stabilize and turn upward to confirm the momentum increase.
If the ADX continues to decline, XLM may enter a correction, but if it rises along with +DI, it will reinforce a strong upward breakout.
XLM CMF, Surging Since March 10
Stellar's Chaikin Money Flow (CMF) indicator has risen to 0.13, recovering from -0.14 three days ago. CMF analyzes price movement and volume to measure buying and selling pressure on a scale of -1 to 1.
A positive CMF value indicates buying pressure is dominant, while a negative value signals strong selling activity.
Generally, a value above 0.05 indicates accumulation, and below -0.05 indicates distribution. CMF is a useful tool for evaluating whether capital is flowing into or out of an asset.
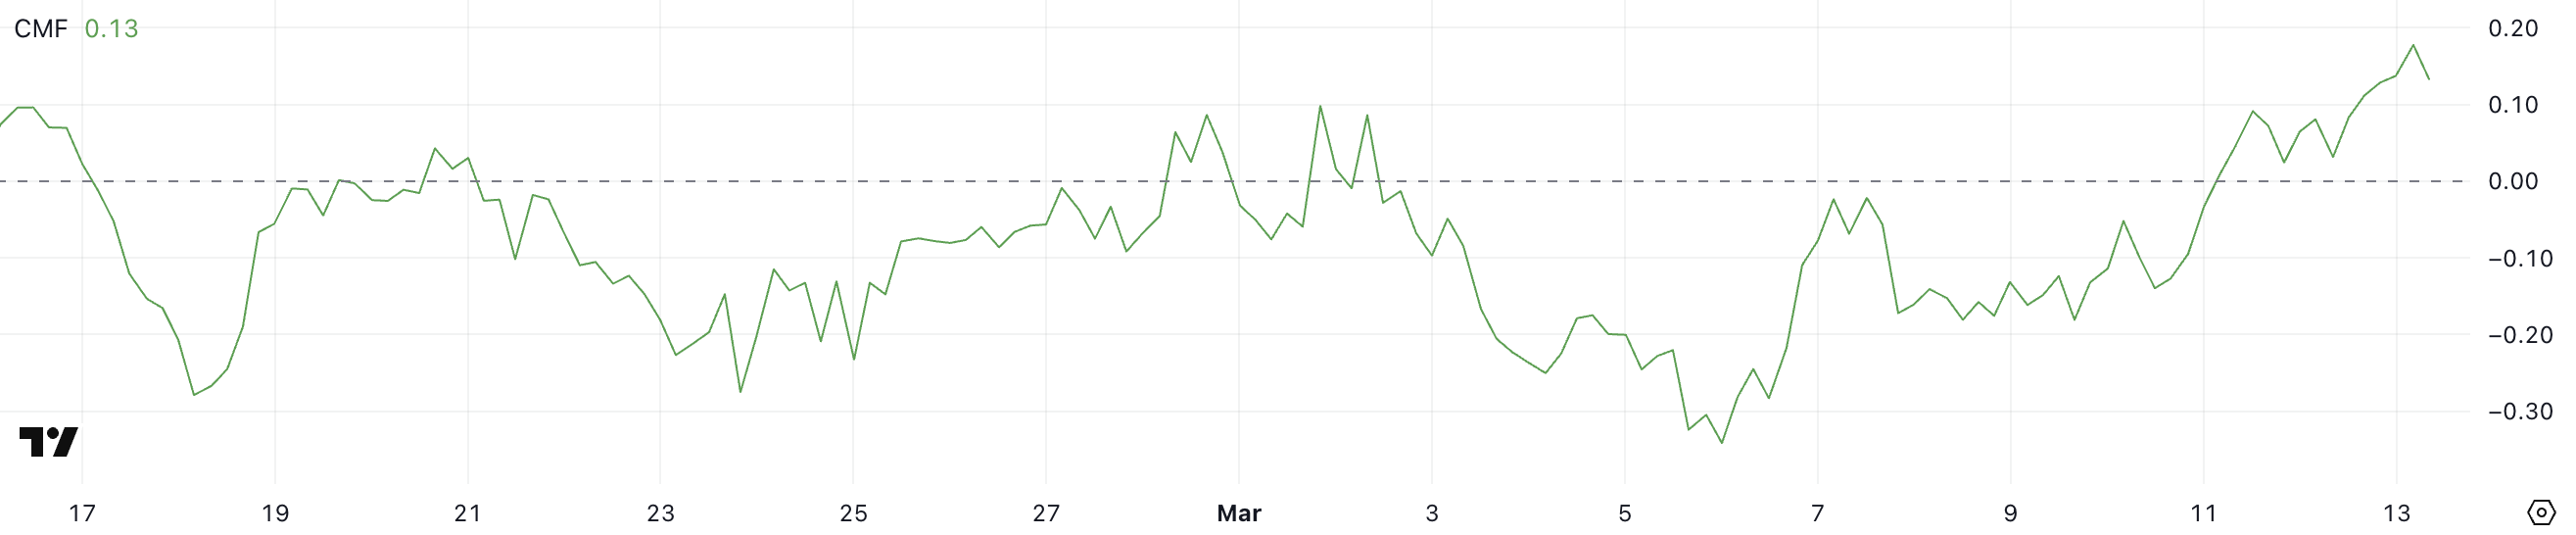
Stellar's CMF reaching 0.13 clearly indicates strengthening buying pressure, reversing the previous downtrend when the CMF was in negative territory.
This change suggests that investors have been accumulating XLM over the past few days, supporting the recent price recovery. However, as the CMF peaked at 0.18 and has slightly declined, some short-term profit-taking may have occurred.
If the CMF remains in positive territory and resumes an upward trend, it will reinforce the potential for further upside, but if it starts to decline back into negative values, it may signal weakening demand and the possibility of price declines.
Will Stellar Break $0.35 in March?
Stellar's EMA lines still indicate a downtrend, with the short-term EMA below the long-term EMA. However, the recent upward movement of the short-term EMA suggests a potential momentum shift and increases the likelihood of a trend reversal.
If the buying pressure continues, Stellar's price may test the $0.309 resistance level, which will be a crucial level in determining whether the recovery can be sustained.
Breaking above this resistance could catalyze further upside, potentially pushing XLM to $0.349. A strong uptrend could lead to a rally towards $0.375.
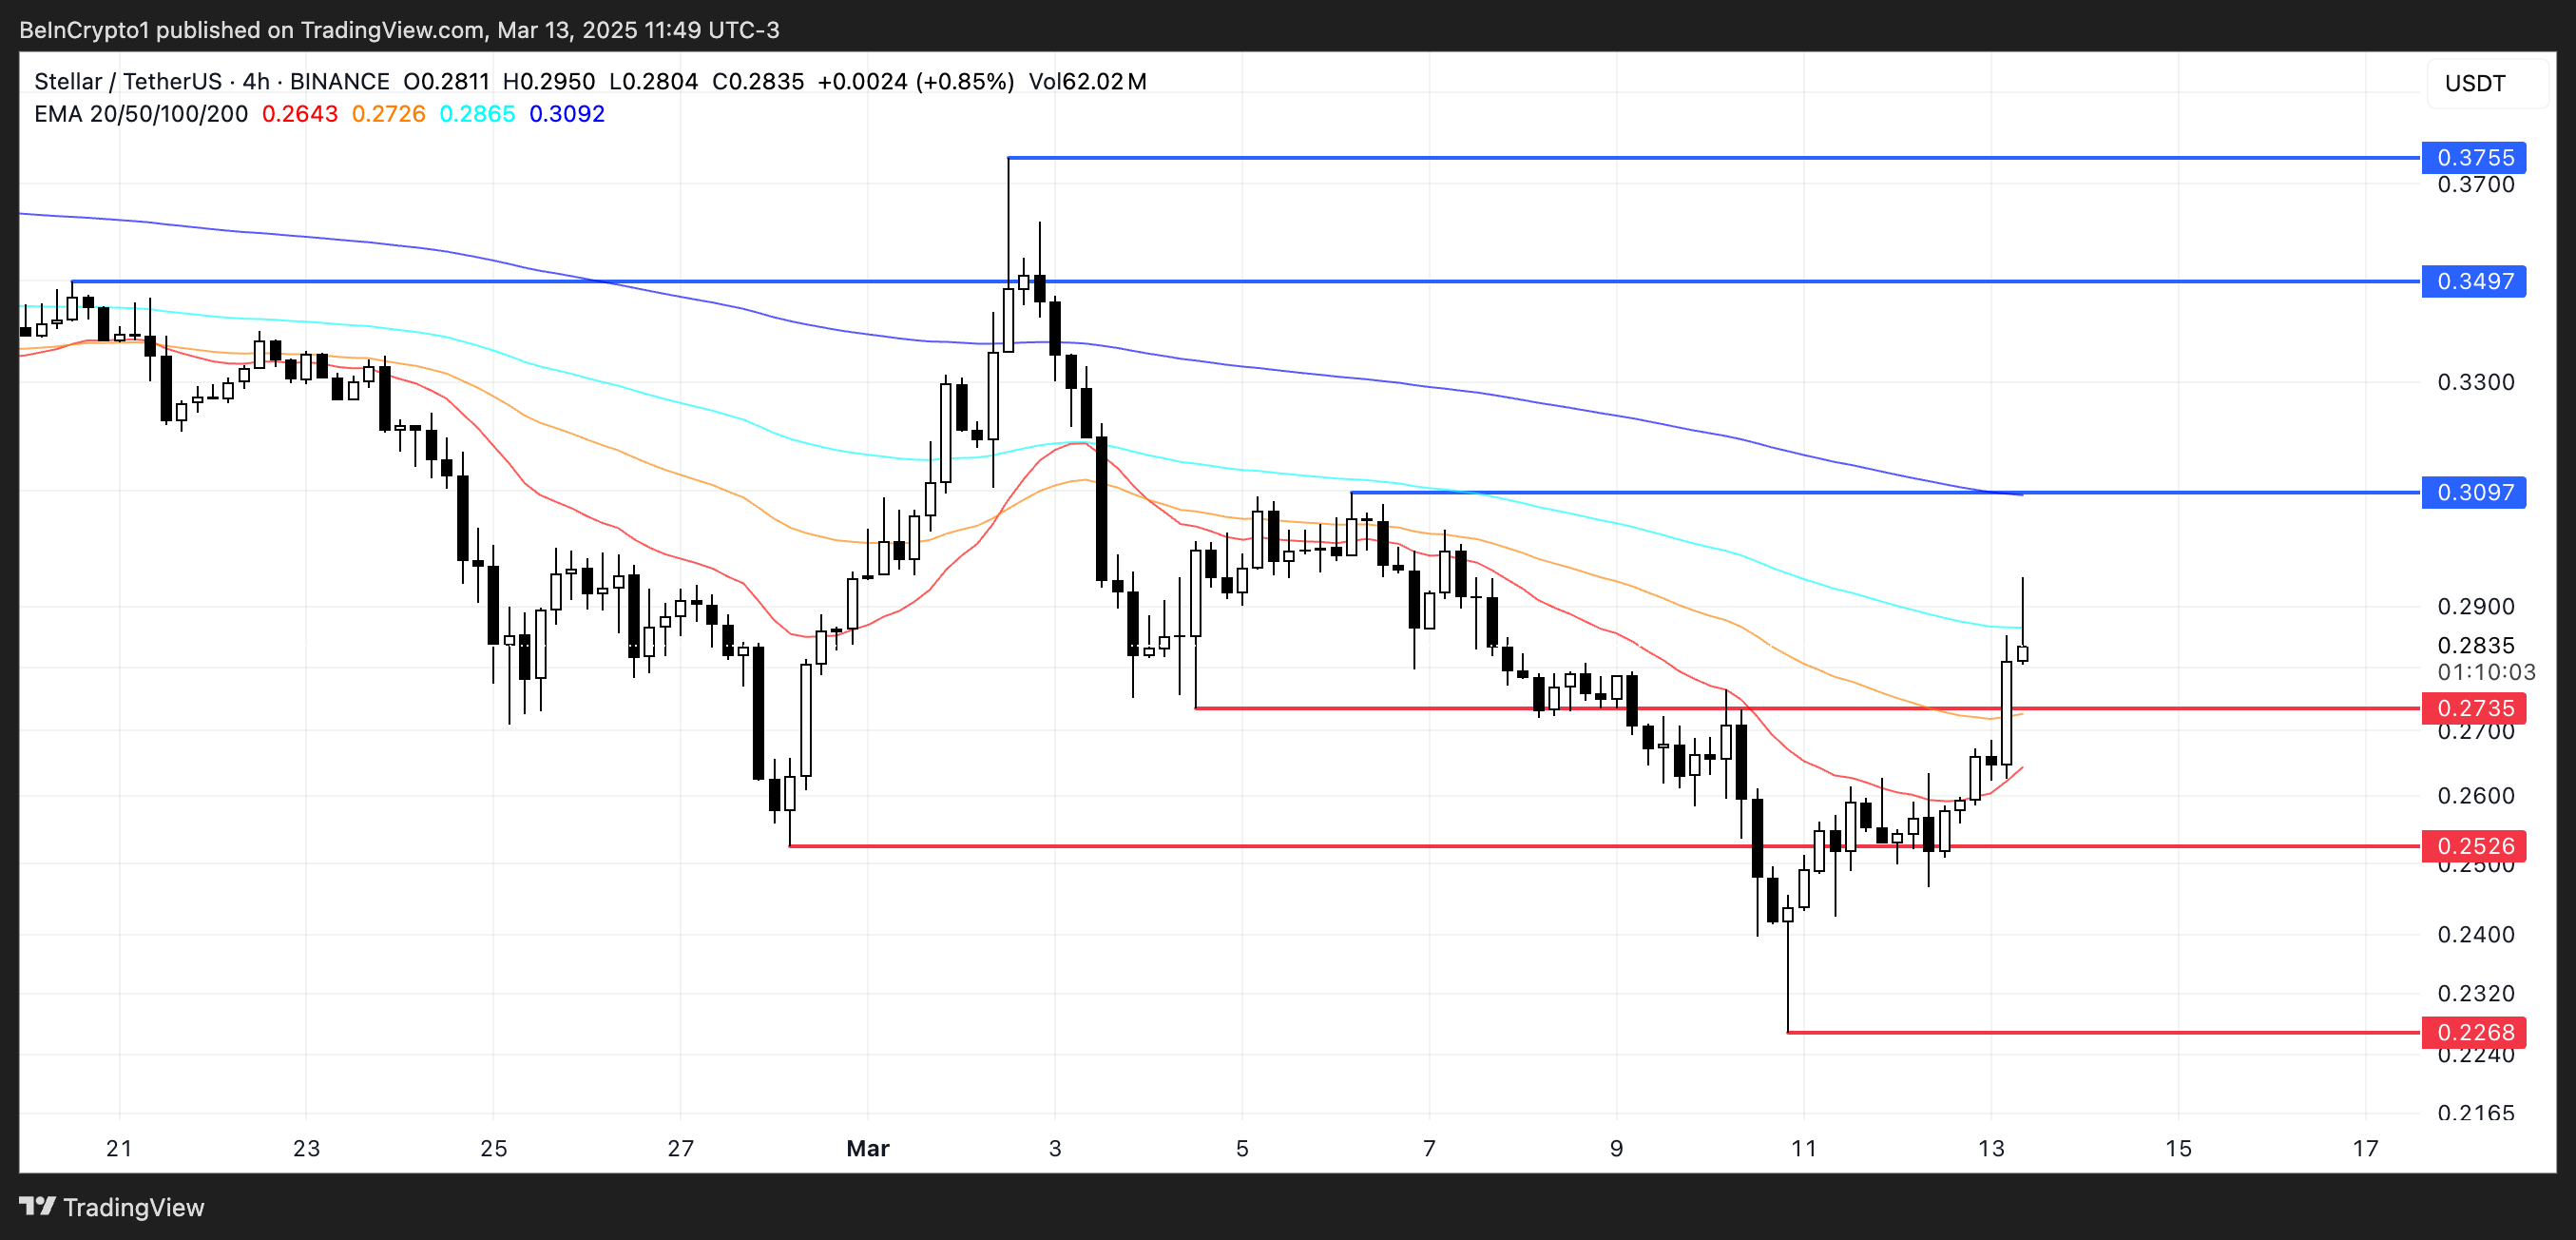
On the downside, if the short-term recovery loses momentum and buyers fail to establish an uptrend, Stellar may face renewed selling pressure.
In this case, the first major support level to watch is $0.273, which has acted as an important area in previous price movements. A break below this level could expose XLM to further losses. The next key support level is $0.252.
If the downtrend strengthens, the price could decline further, potentially reaching $0.226, which would indicate a deeper correction before a potential reversal.


