

Ethereum (ETH) has shown strength, rising nearly 9% over the past 7 days. However, the price is still struggling around the $2,000 mark. Despite this upward movement, key indicators suggest that the market still lacks decisive momentum.
Various indicators, from trend strength to whale activity and support/resistance levels, indicate that the market has entered a correction phase. Whether Ethereum will break through or decline depends on how it responds to technical levels and changes in investor behavior in the coming days.
Ethereum BBTrend Positive
Ethereum's BBTrend is currently located at 3.23 and has remained in the positive area over the past 3 days. This indicator peaked at 3.93 on March 22nd, showing a strong short-term trend.
This continuous positive figure suggests that Ethereum may be regaining momentum, but not aggressively.
Notably, the last time BBTrend reached above 5 was on February 26th, which is typically associated with strong trend conditions. Since then, this indicator has shown moderate intensity but has not yet entered the high momentum area.
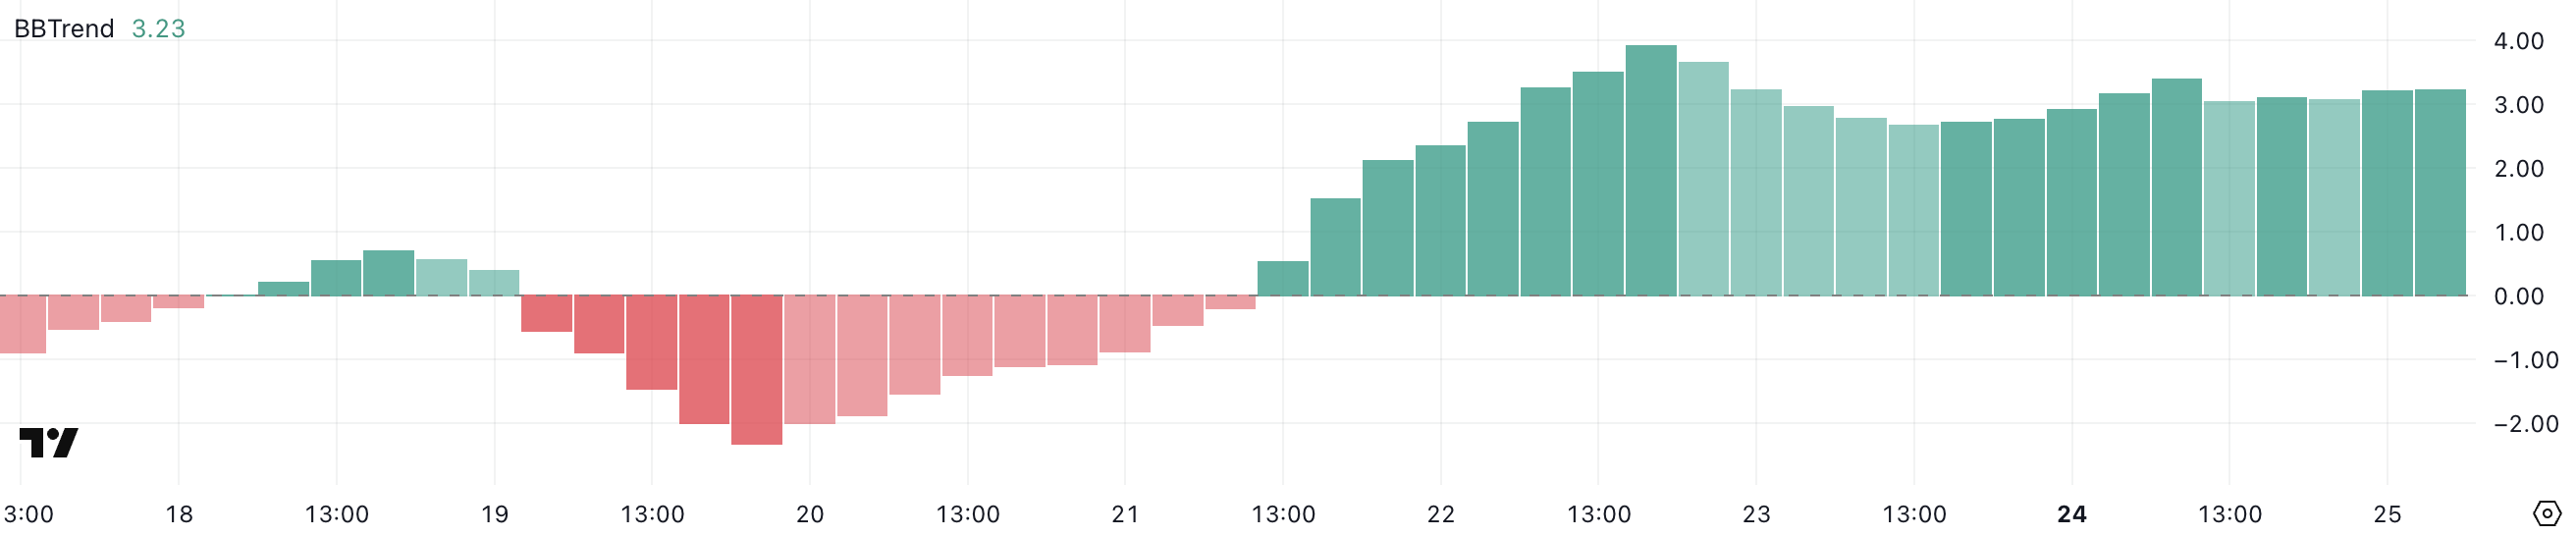
BBTrend is an abbreviation for Bollinger Bands Trend, a technical indicator measuring the strength of price trends. It quantifies how far the price deviates from the average, typically using Bollinger Bands as a reference.
Values below 0.5 indicate trend weakness or volatility, while values above 1.0 suggest increasing trend strength. Values above 3 are considered signals of a solid trend, and values above 5 indicate a strong directional movement.
Ethereum's BBTrend hovering at 3.23 shows some directionality, but the lack of values above 5 in the past month may suggest that ETH is showing a trend but has not yet broken through or reached a high momentum stage.
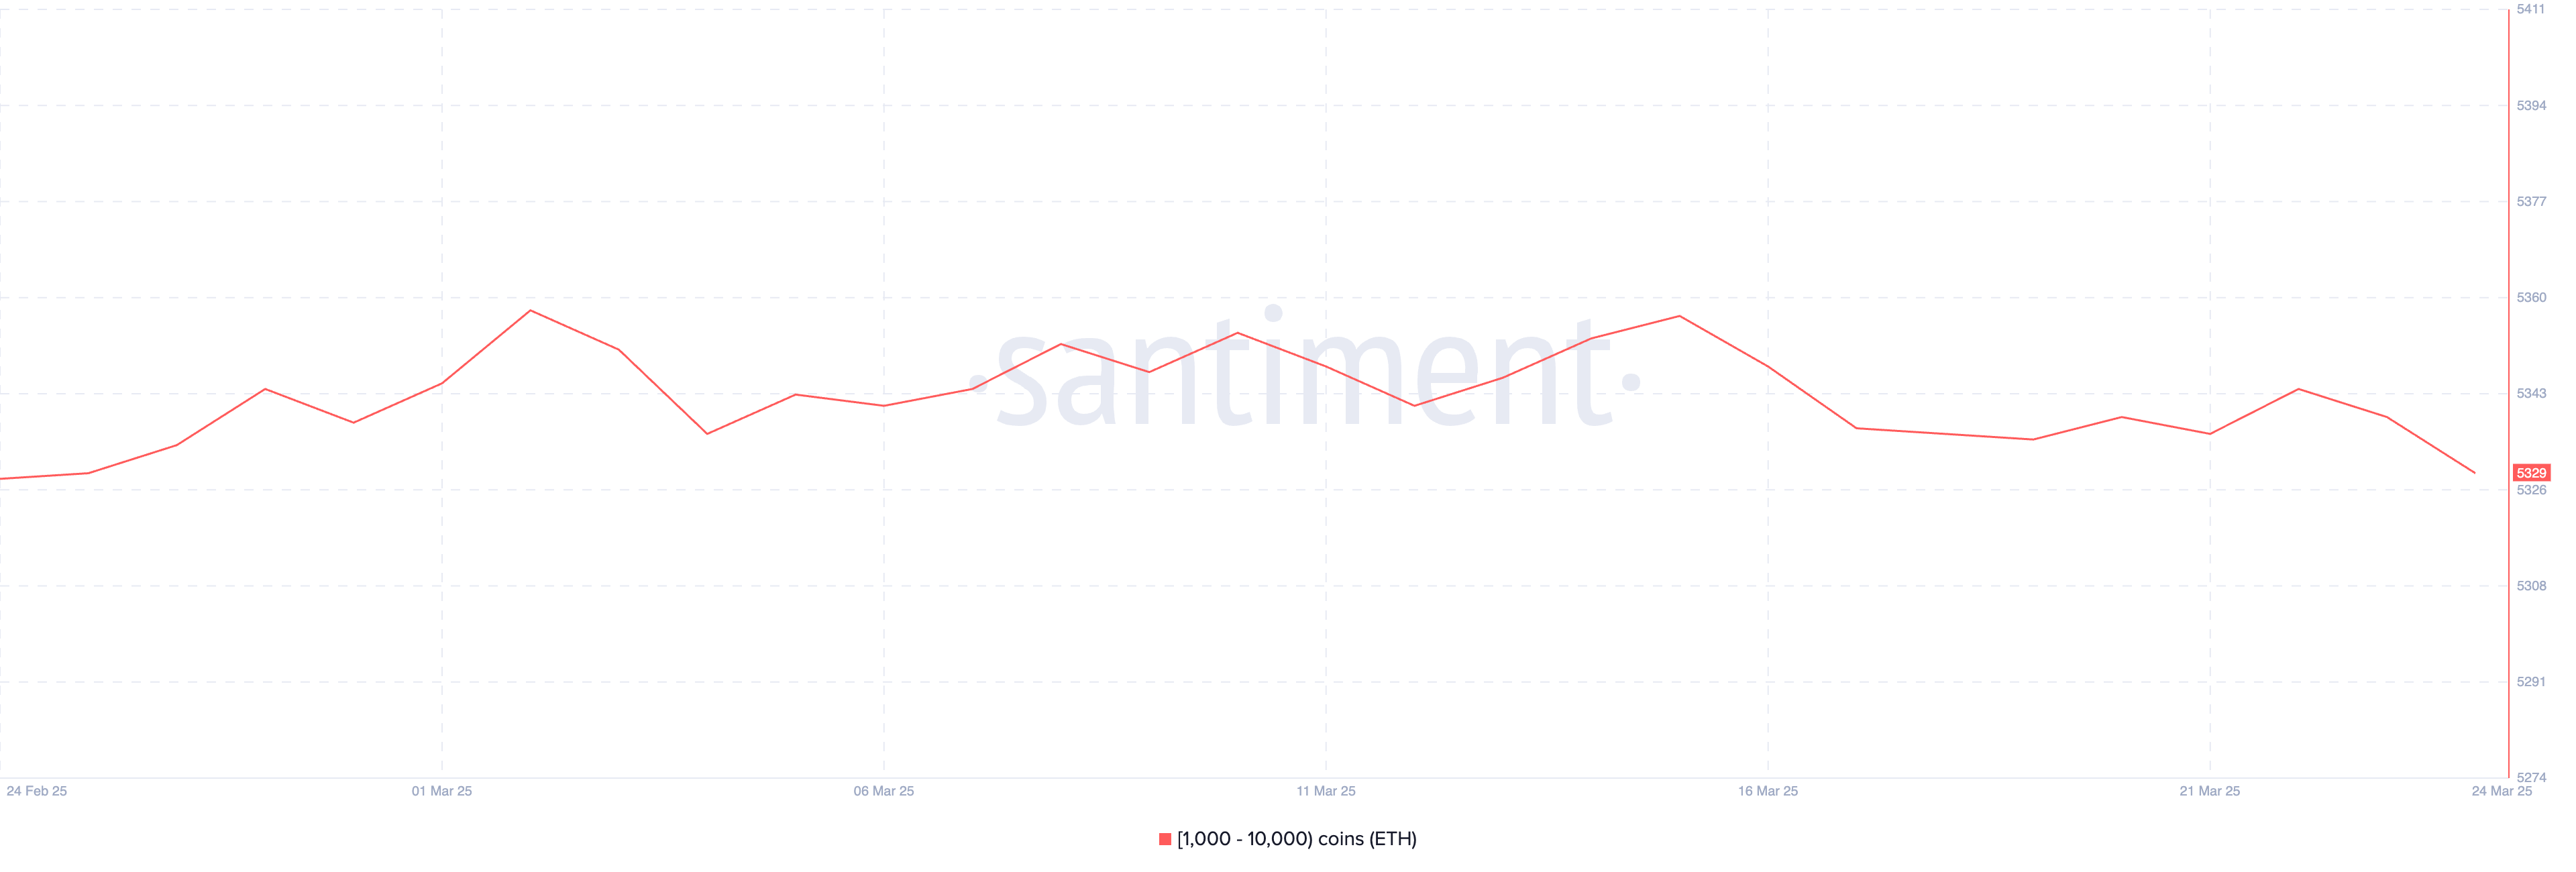
Whales Reach Monthly Low
The number of Ethereum whales holding between 1,000 and 10,000 ETH has decreased to 5,329. This is a decrease from 5,344 three days ago.
This slight decrease suggests that large holders' confidence or positions are gradually declining. Importantly, this is the lowest whale count observed since February 25th, marking a monthly low.
While the change may seem small, even subtle movements in whale behavior can have ripple effects on the broader market, especially when trend indicators are showing moderate intensity.
Tracking Ethereum whale wallets is important because these large holders have the power to influence prices through significant buying or selling activities.
Whales often act as smart money, and changes in their accumulation or distribution patterns can serve as early signals of broader market changes. The decrease in whale count may imply that some large investors are realizing profits, adjusting positions, or taking a more cautious approach.
The fact that whale wallet count is currently at a monthly low may suggest increasing hesitation at higher price levels and could limit ETH's upward momentum unless new funds flow in or investor confidence is restored.
Ethereum to Fall Below $2,000 Again?
Ethereum's moving averages currently suggest a correction phase, with price movements still struggling around the $2,000 mark. The lack of clear direction reflects market uncertainty, with ETH trading within a narrowing range.
On the downside, if Ethereum's price tests and fails to maintain the key support level of $1,938, the next downward targets are $1,867 and potentially $1,759.
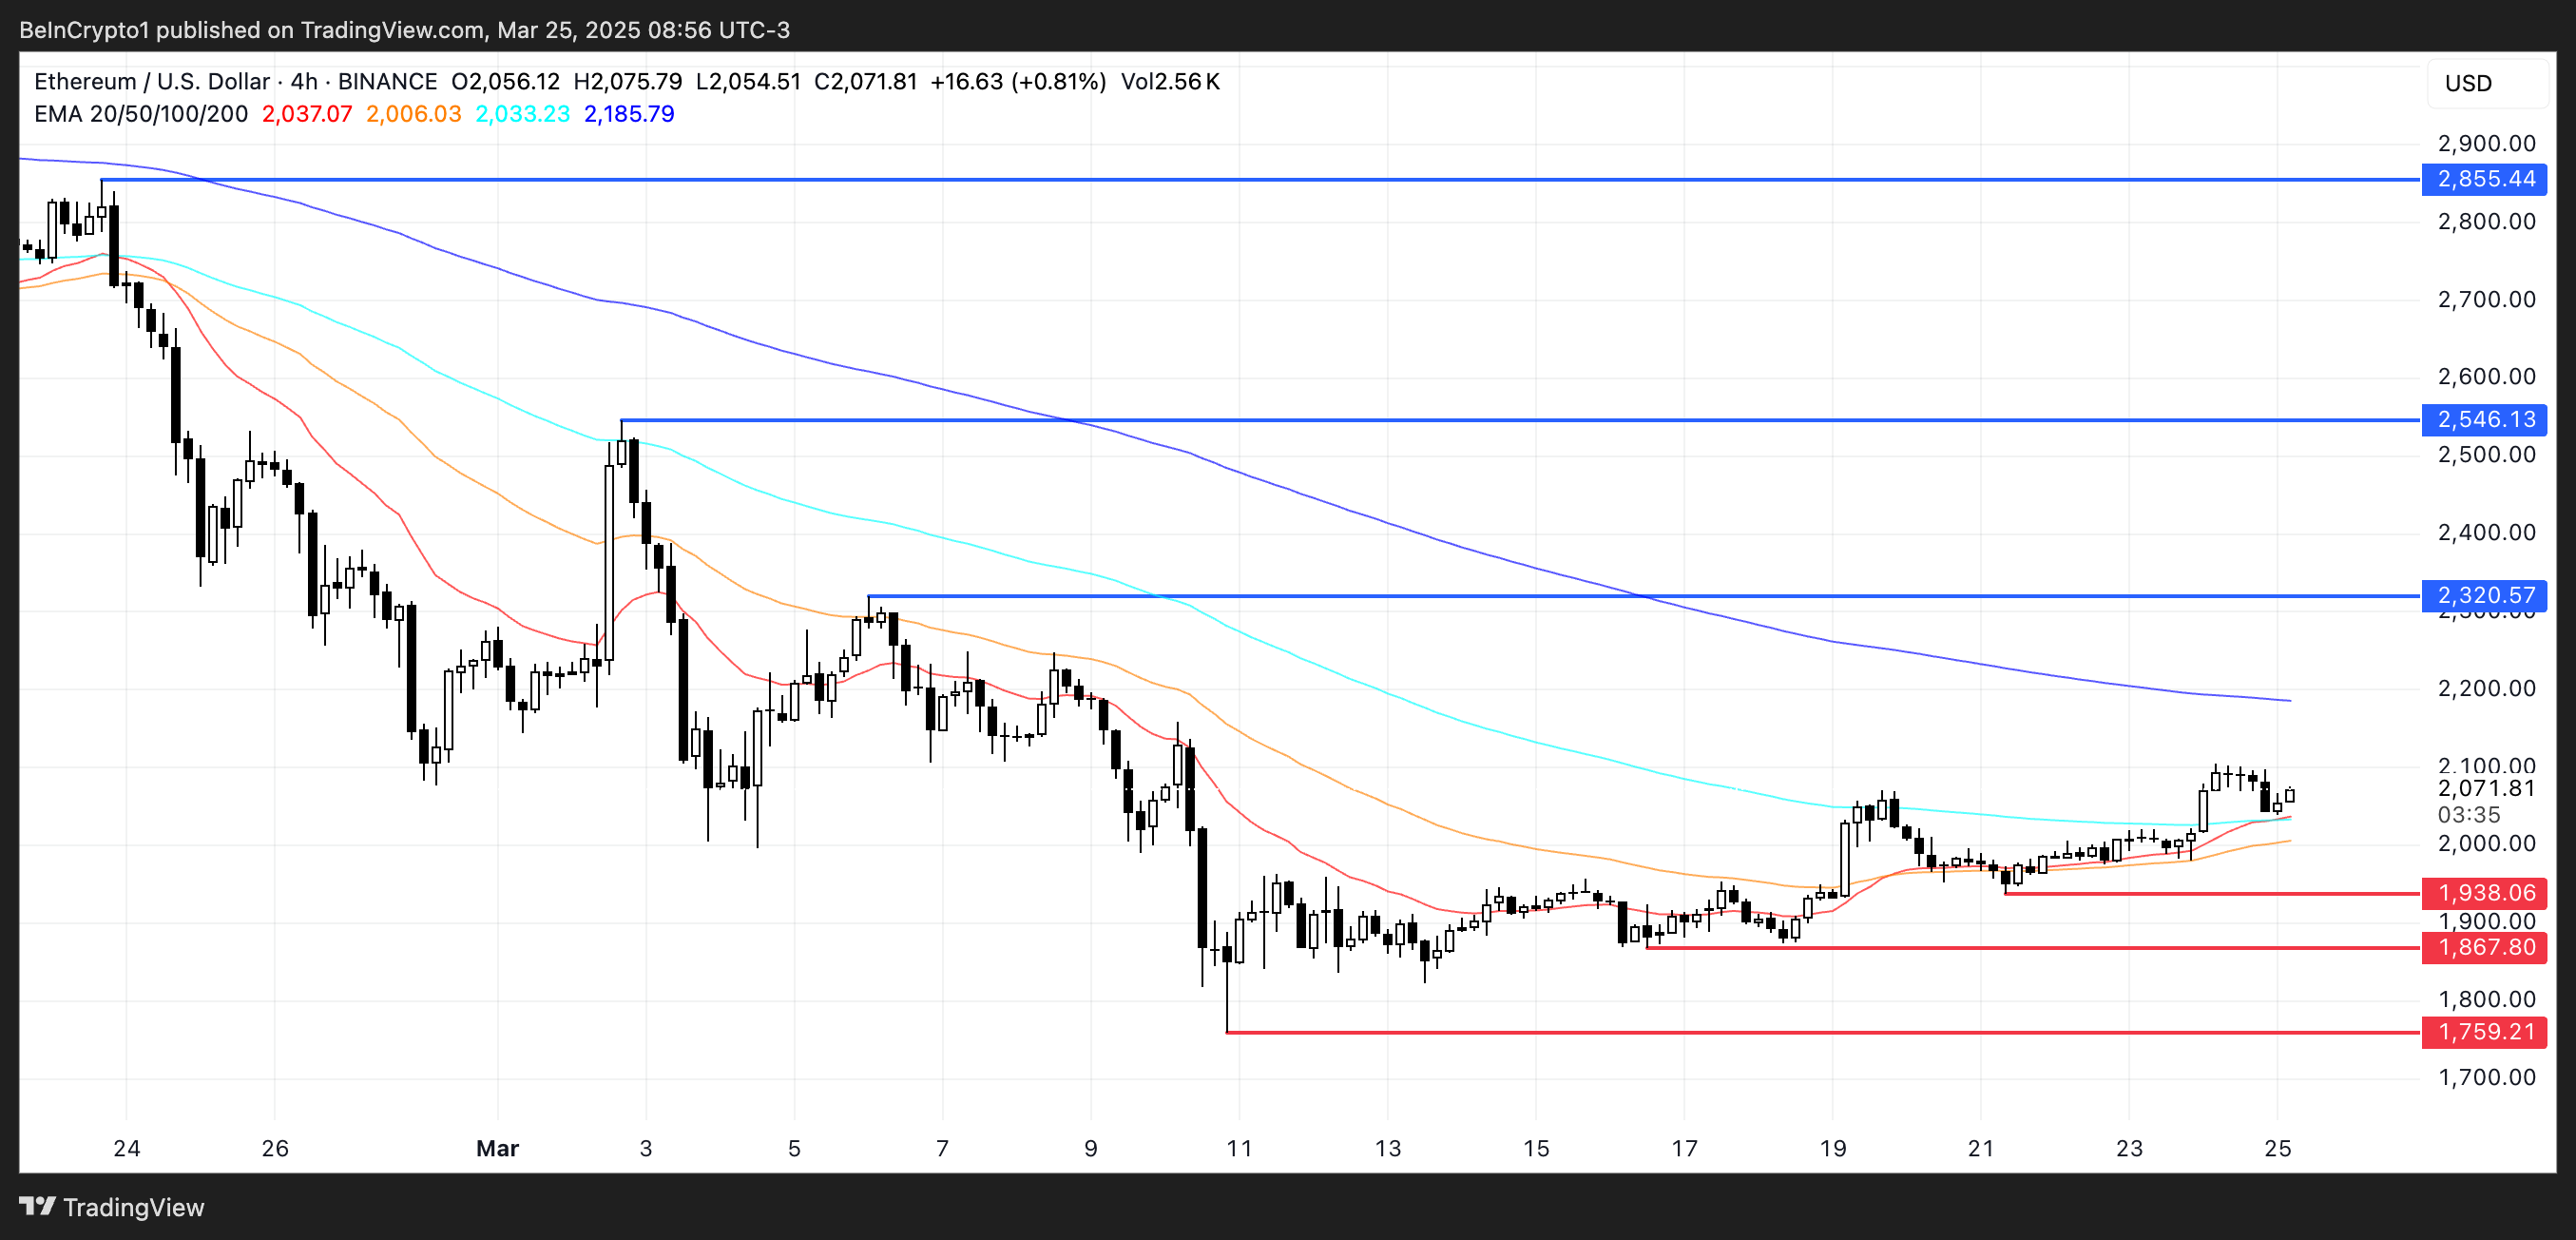
Conversely, if Ethereum gathers bullish momentum and builds a sustained upward trend, the first major resistance to watch is $2,320.
Successfully breaking this level could trigger a rise to $2,546, and if momentum accelerates, it could reach $2,855.

