

Stellar (XLM) rose by 11% over the past 7 days, reaching a market capitalization of nearly $9 billion. The upward momentum continues to build. After a correction, recent indicators suggest that XLM is preparing to rise again.
Technical indicators such as RSI and DMI reflect buyer strength. The price has not yet entered the overbought area, indicating room for further increase.
XLM RSI, Drawing a Bullish Picture
Stellar's Relative Strength Index (RSI) is currently at 63.42, strongly rising from 44.21 three days ago. This indicator has been maintained above 55 since yesterday, indicating strengthening upward momentum.
This recent rise represents increased buying interest, suggesting Stellar could break through if momentum continues to build.
However, despite the upward movement, Stellar's RSI has not exceeded 70 since March 2nd. This indicates buyers are active, but the asset has not entered an overbought or high momentum state.
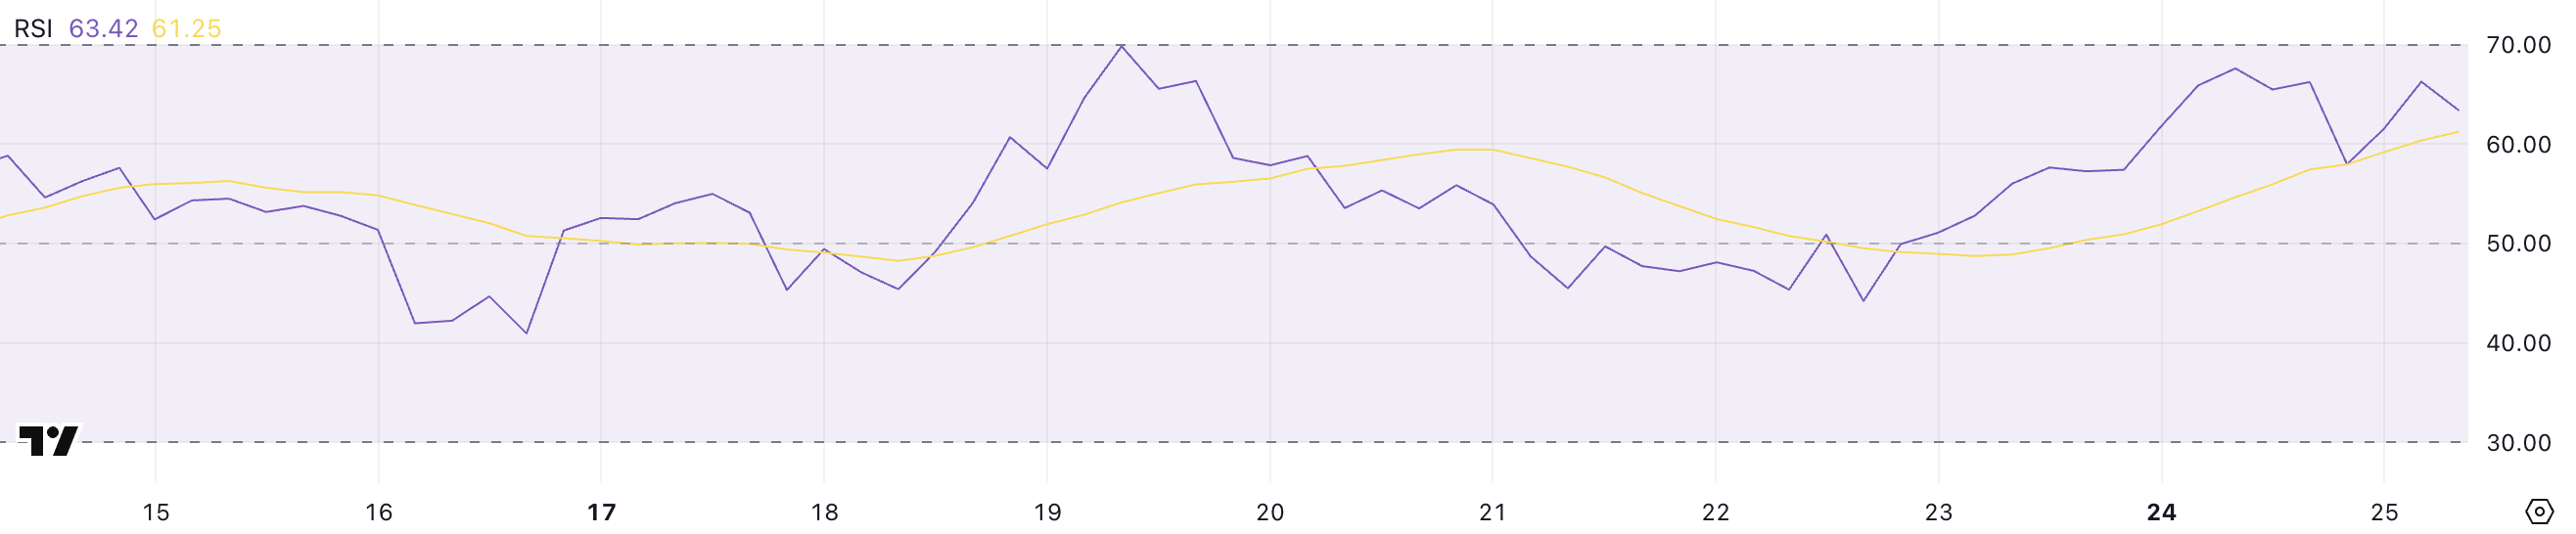
RSI, or Relative Strength Index, is a momentum indicator that measures the speed and magnitude of recent price changes to assess overbought or oversold conditions.
The RSI scale ranges from 0 to 100, with values above 70 indicating a potentially overbought asset, and values below 30 suggesting an oversold condition and potential rebound. Generally, values between 50 and 70 indicate moderate upward momentum, while 30 to 50 signifies a decline.
With XLM's RSI currently at 63.42, the trend looks positive. However, not exceeding 70 since early March may suggest the market is waiting for greater confidence.
Stellar DMI, Buyers Completely Dominating
Stellar's DMI (Directional Movement Index) chart shows ADX currently at 30.63, sharply rising from 16.2 two days ago.
This significant ADX increase suggests the trend is strengthening, confirming increased momentum in the current price movement, whether upward or downward. Simultaneously, the +DI line tracking upward pressure has slightly decreased from 24.5 to 21.77 yesterday, while the -DI line reflecting downward pressure has also reduced from 8.65 to 7.34.
Despite decreased buying strength, the large difference between +DI and -DI lines continues to support the upward trend. This indicates the current trend is bullish but may be weakening.
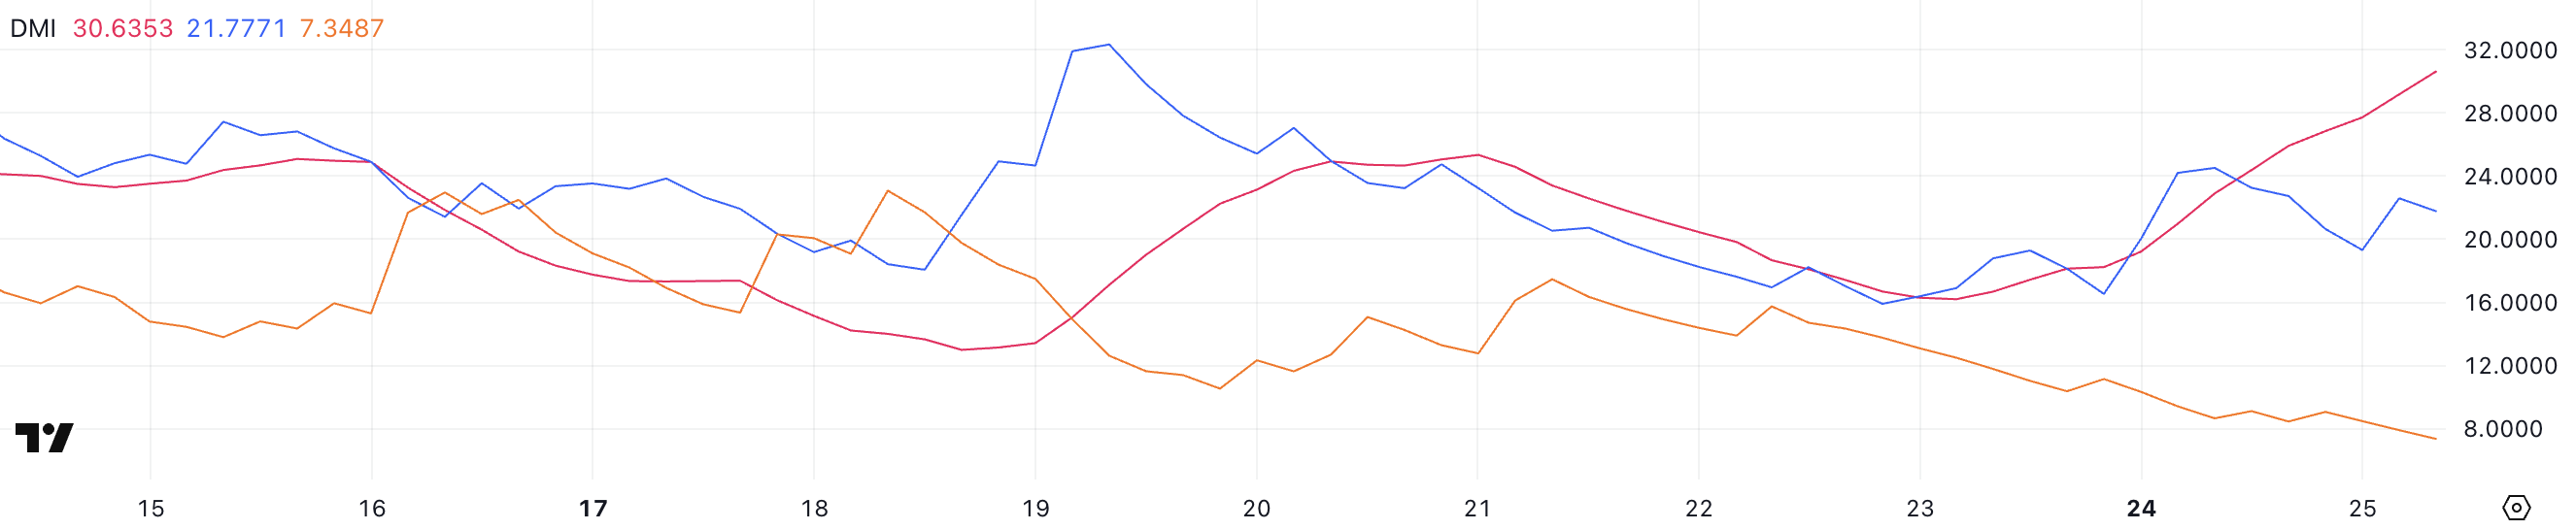
ADX, or Average Directional Index, is a component of the DMI system used to quantify trend strength regardless of direction. Values below 20 indicate weak or non-existent trends, values above 25 suggest a strengthening trend, and values above 30 confirm a strong trend.
+DI and -DI lines help determine the trend's direction. Higher values indicate control by buyers (+DI) or sellers (-DI).
With ADX exceeding 30 and +DI remaining higher than -DI, Stellar appears to be in a solid upward trend. However, the recent decline in +DI suggests potential momentum weakening, and the next few days will be crucial in confirming trend continuation.
Will XLM Break $0.40 in April?
Stellar's EMA (Exponential Moving Average) lines are showing a potential crossover, with short-term moving averages attempting to cross above long-term moving averages, indicating a potential surge.
If this crossover occurs, it would form a "Golden Cross" pattern, often considered a strong signal for continued ascent.
This technical setup could enable Stellar's price to rise to the $0.30 level, with additional upward targets of $0.349 and $0.375 if momentum accelerates. This could pave the way for a rise above $0.40 in April.
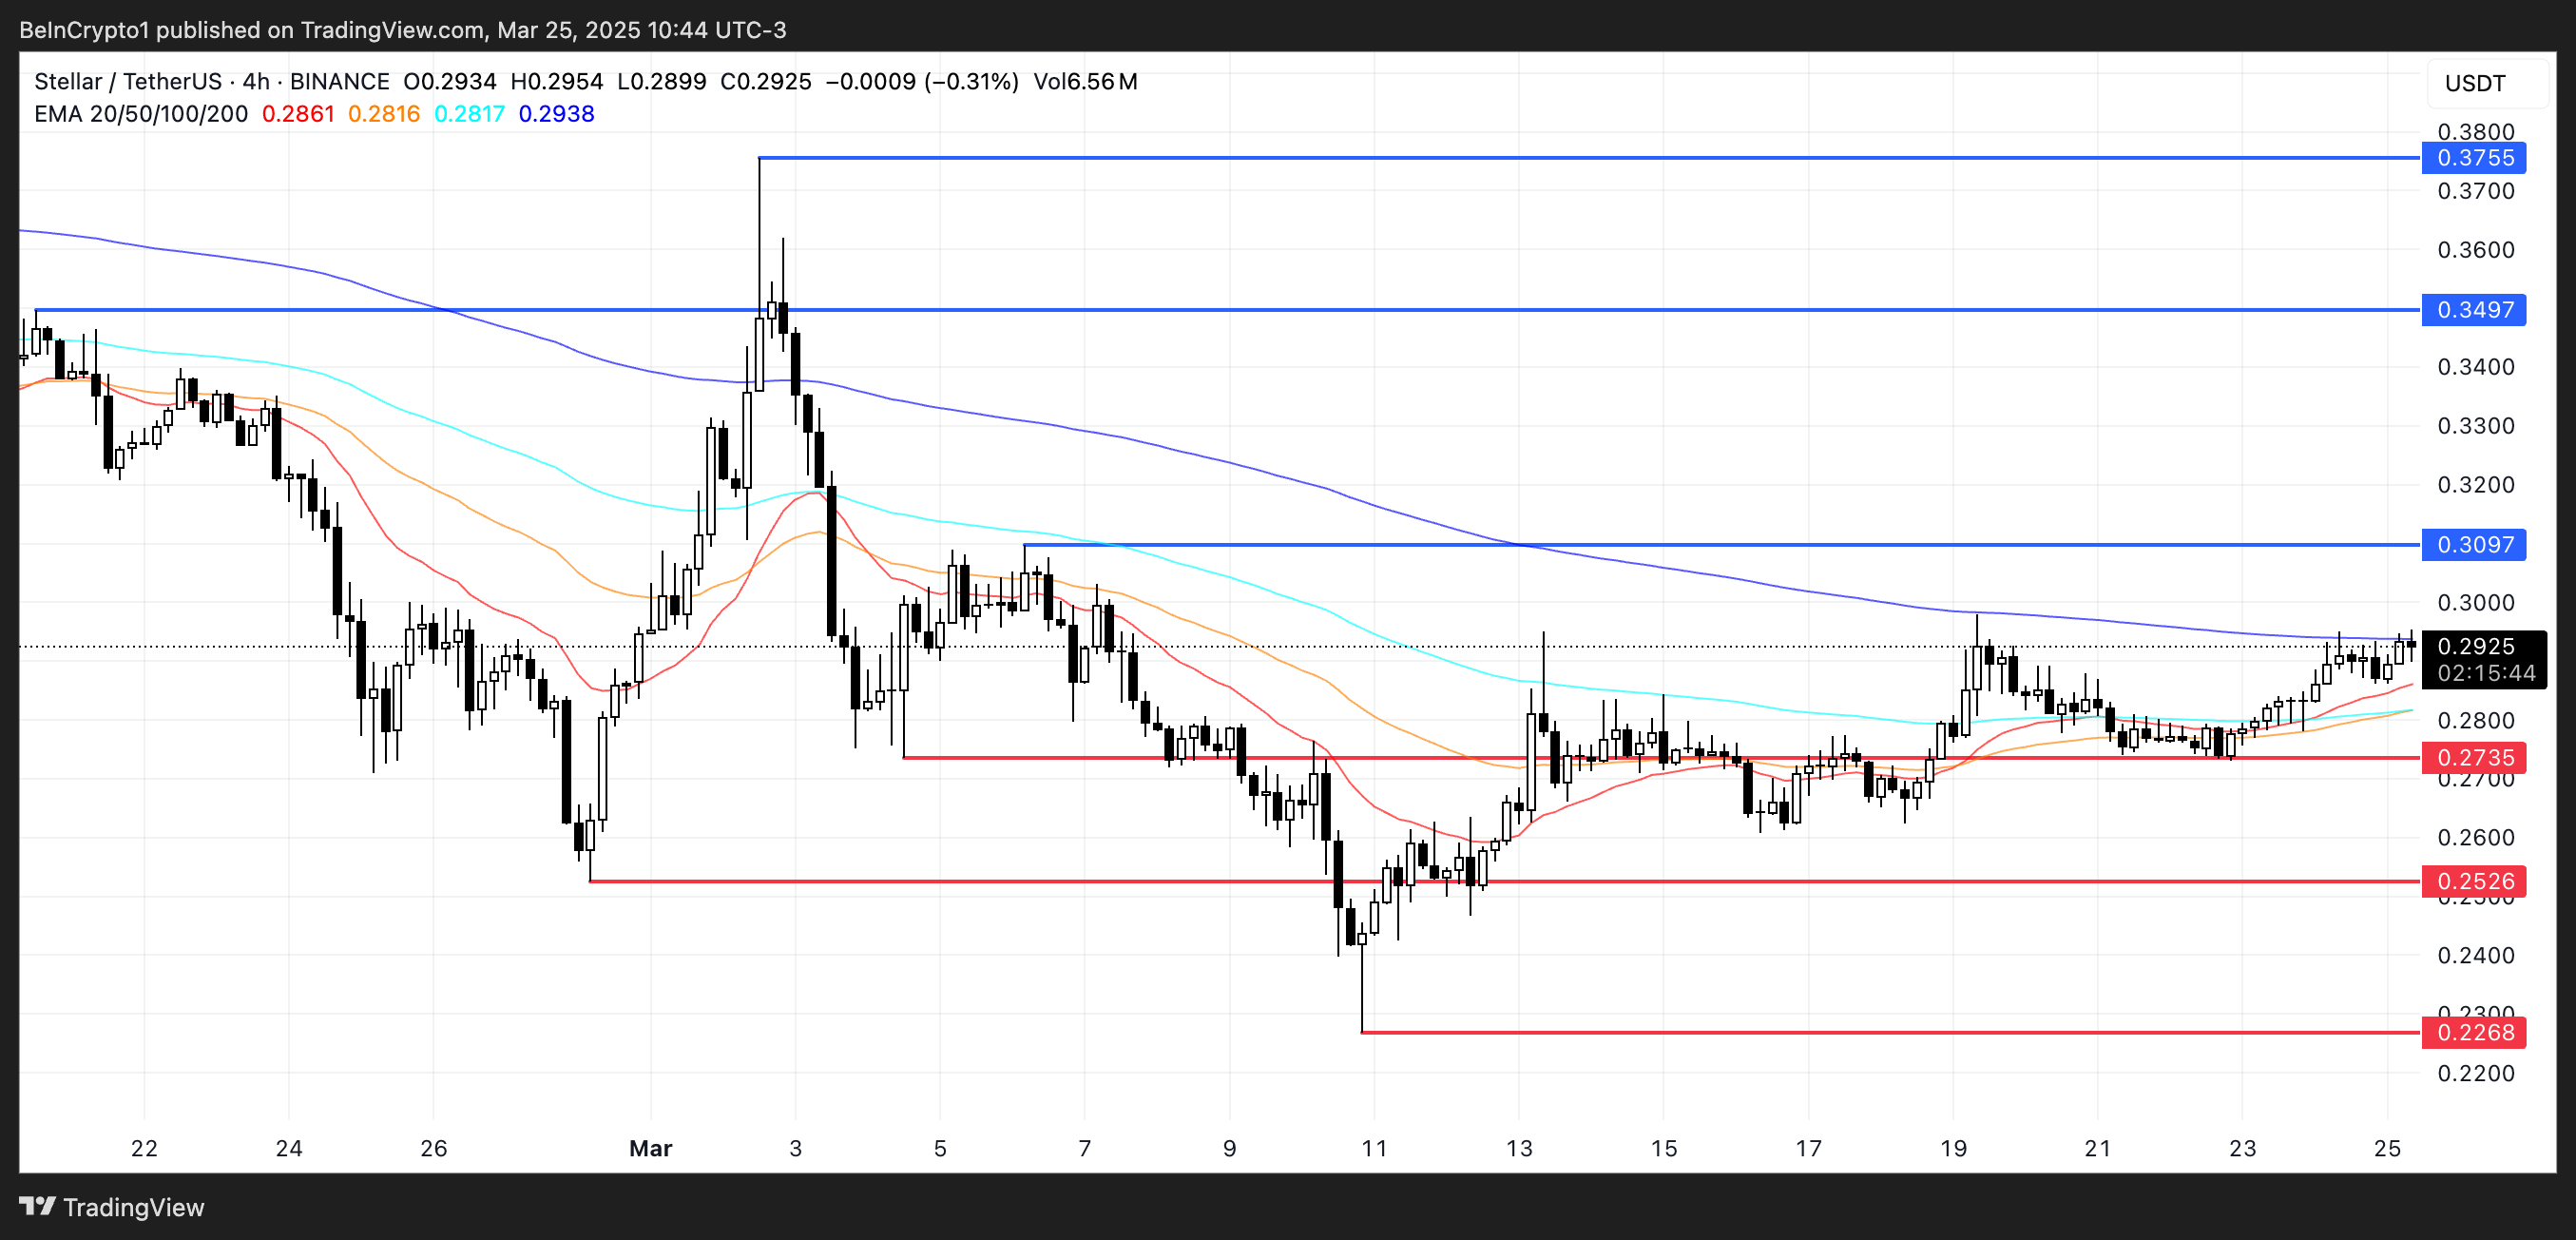
This EMA convergence suggests building upward pressure, which could lead to a breakout if confirmed by price movement.
However, if the anticipated Golden Cross fails to materialize and a downward trend forms, Stellar might test support levels around $0.27.
Falling below that support level could trigger further decline to $0.25, and if selling intensifies, it could drop to $0.22.


