

Mantra (OM) has fallen by 20% over the past 30 days and dropped 5% today. Despite this recent adjustment, it remains the second-largest real-world asset (RWA) token in the market.
The technical outlook suggests increasing signs of weakness, indicating that the current adjustment could turn into a downward trend. At the same time, key support levels are being tested, and a death cross is forming on the EMA chart.
Mantra ADX, Potential Change in Current Adjustment
Mantra's ADX is currently at 22.96, down from 26.5 the previous day, indicating a bearish trend. ADX, or the Average Directional Index, measures the strength of a trend but does not indicate direction.
Values below 20 indicate a weak or non-trending market, while values above 25 suggest a strong trend is forming or in progress.
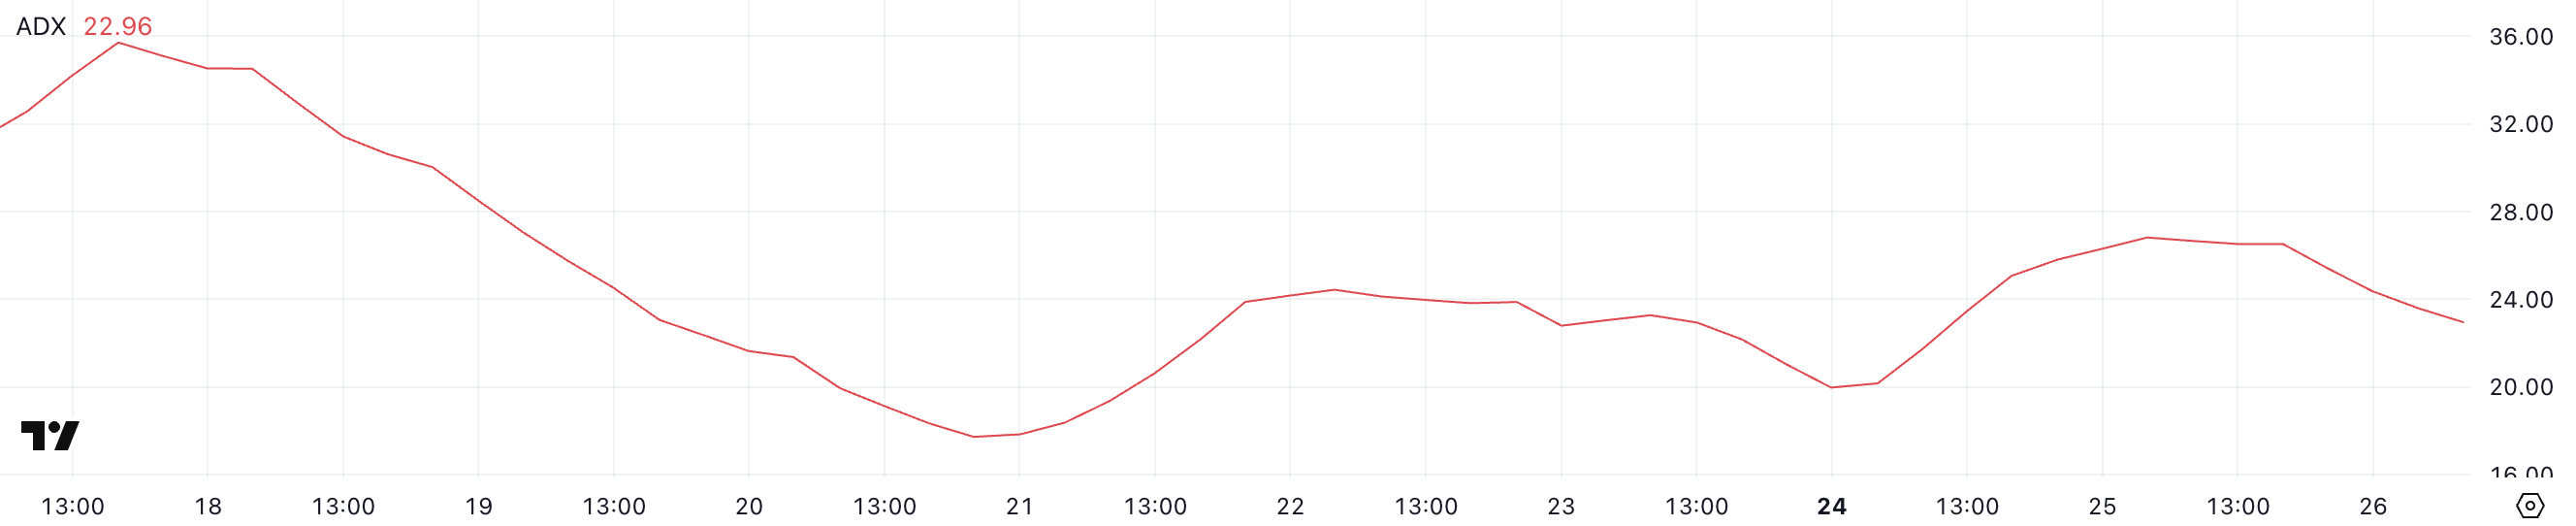
OM's ADX now falling below the key threshold of 25 suggests that the previous trend of adjustment is weakening.
This decline aligns with early signs of a potential transition to a downward trend, especially if selling pressure increases. If the ADX continues to fall and bearish momentum increases, it can be confirmed that Mantra may transition from adjustment to a downward phase.
Ichimoku Cloud, Potential Intensification of Downward Trend
Mantra's Ichimoku chart currently shows a hesitant state, with price moving along the cloud's edge. This reflects an adjustment state where buyers and sellers are not fully in control, and Mantra maintains its position as the second-largest RWA coin in the market.
The conversion line (blue) and base line (red) are flat and close, which is a typical signal of weak momentum and sideways movement in the short term. This setup often appears as a precursor to a breakout, but the direction remains uncertain until a clear movement occurs.
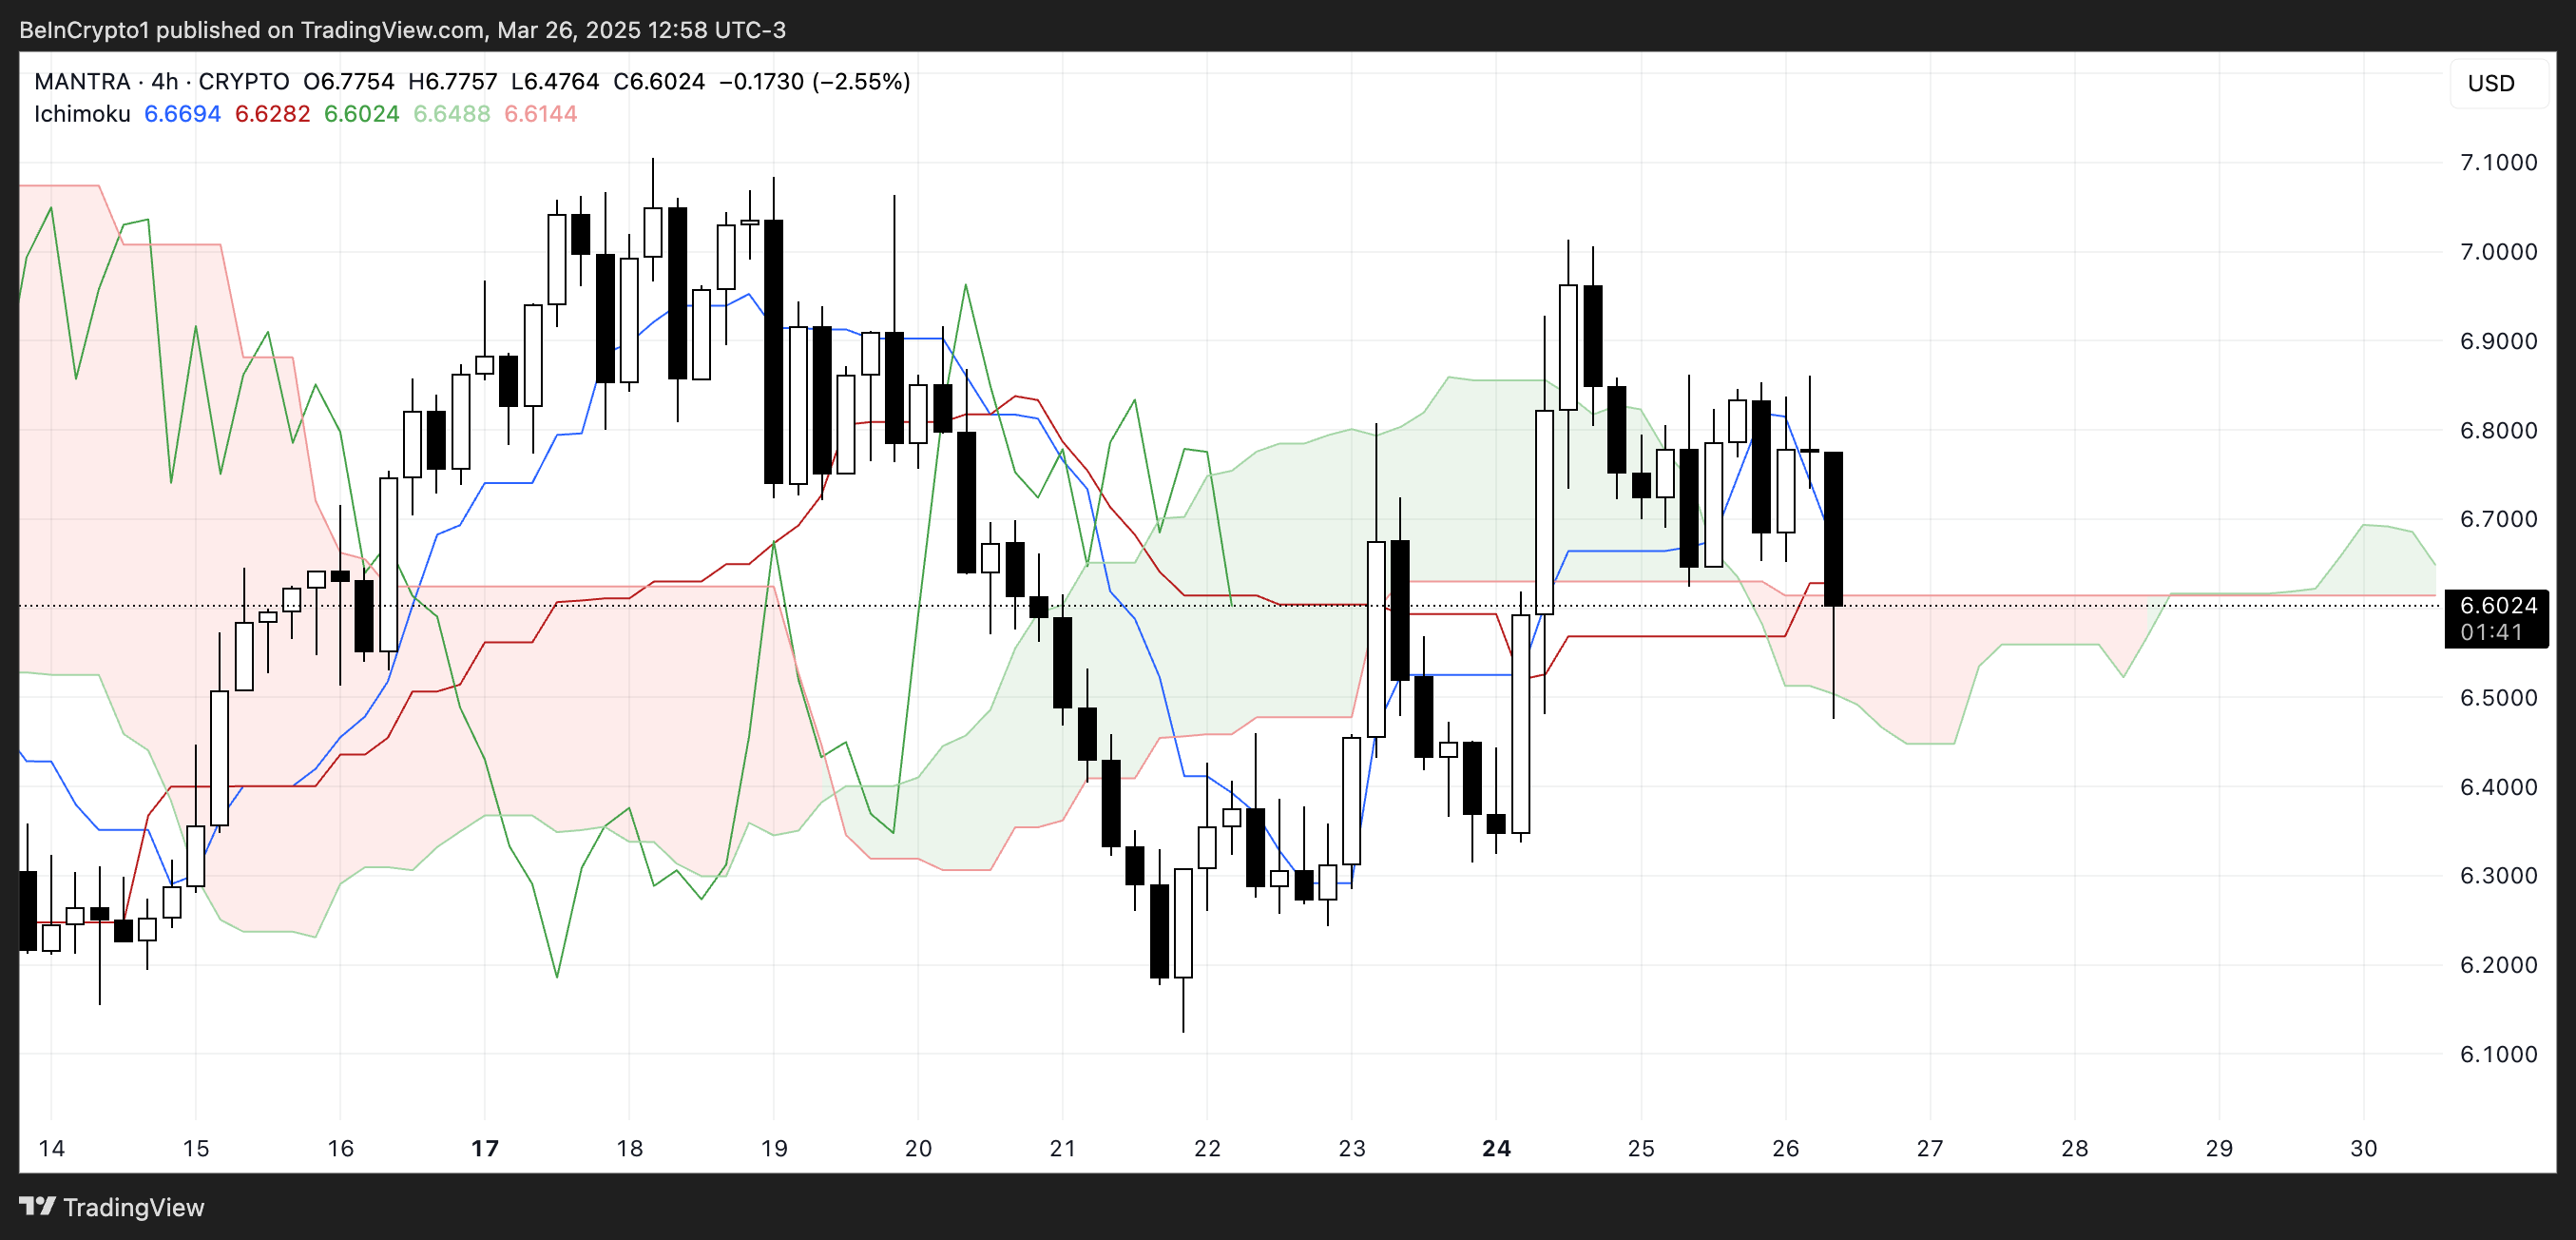
The future cloud is thin and slightly bearish (red). This indicates weak support ahead that can easily be broken if selling pressure increases.
Additionally, the indicator line (lagging line) is entangled with recent price movements, another indicator that OM lacks strong directionality.
While the price has not yet clearly fallen below the cloud, additional decline could shift the bias to a confirmed downward trend. Currently, OM is in a vulnerable position, and traders will carefully watch whether the cloud will serve as support or collapse.
Mantra, Possibility of Falling Below $6?
Mantra's moving averages suggest bearishness and a death cross is likely to form soon. This is a bearish pattern where the short-term moving average crosses below the long-term moving average.
If this pattern is confirmed and downward pressure increases, OM may test the $6.15 support level. Falling below this level could lead to a further decline to $5.85, which could lead to a deeper correction phase in the absence of new bullish momentum.
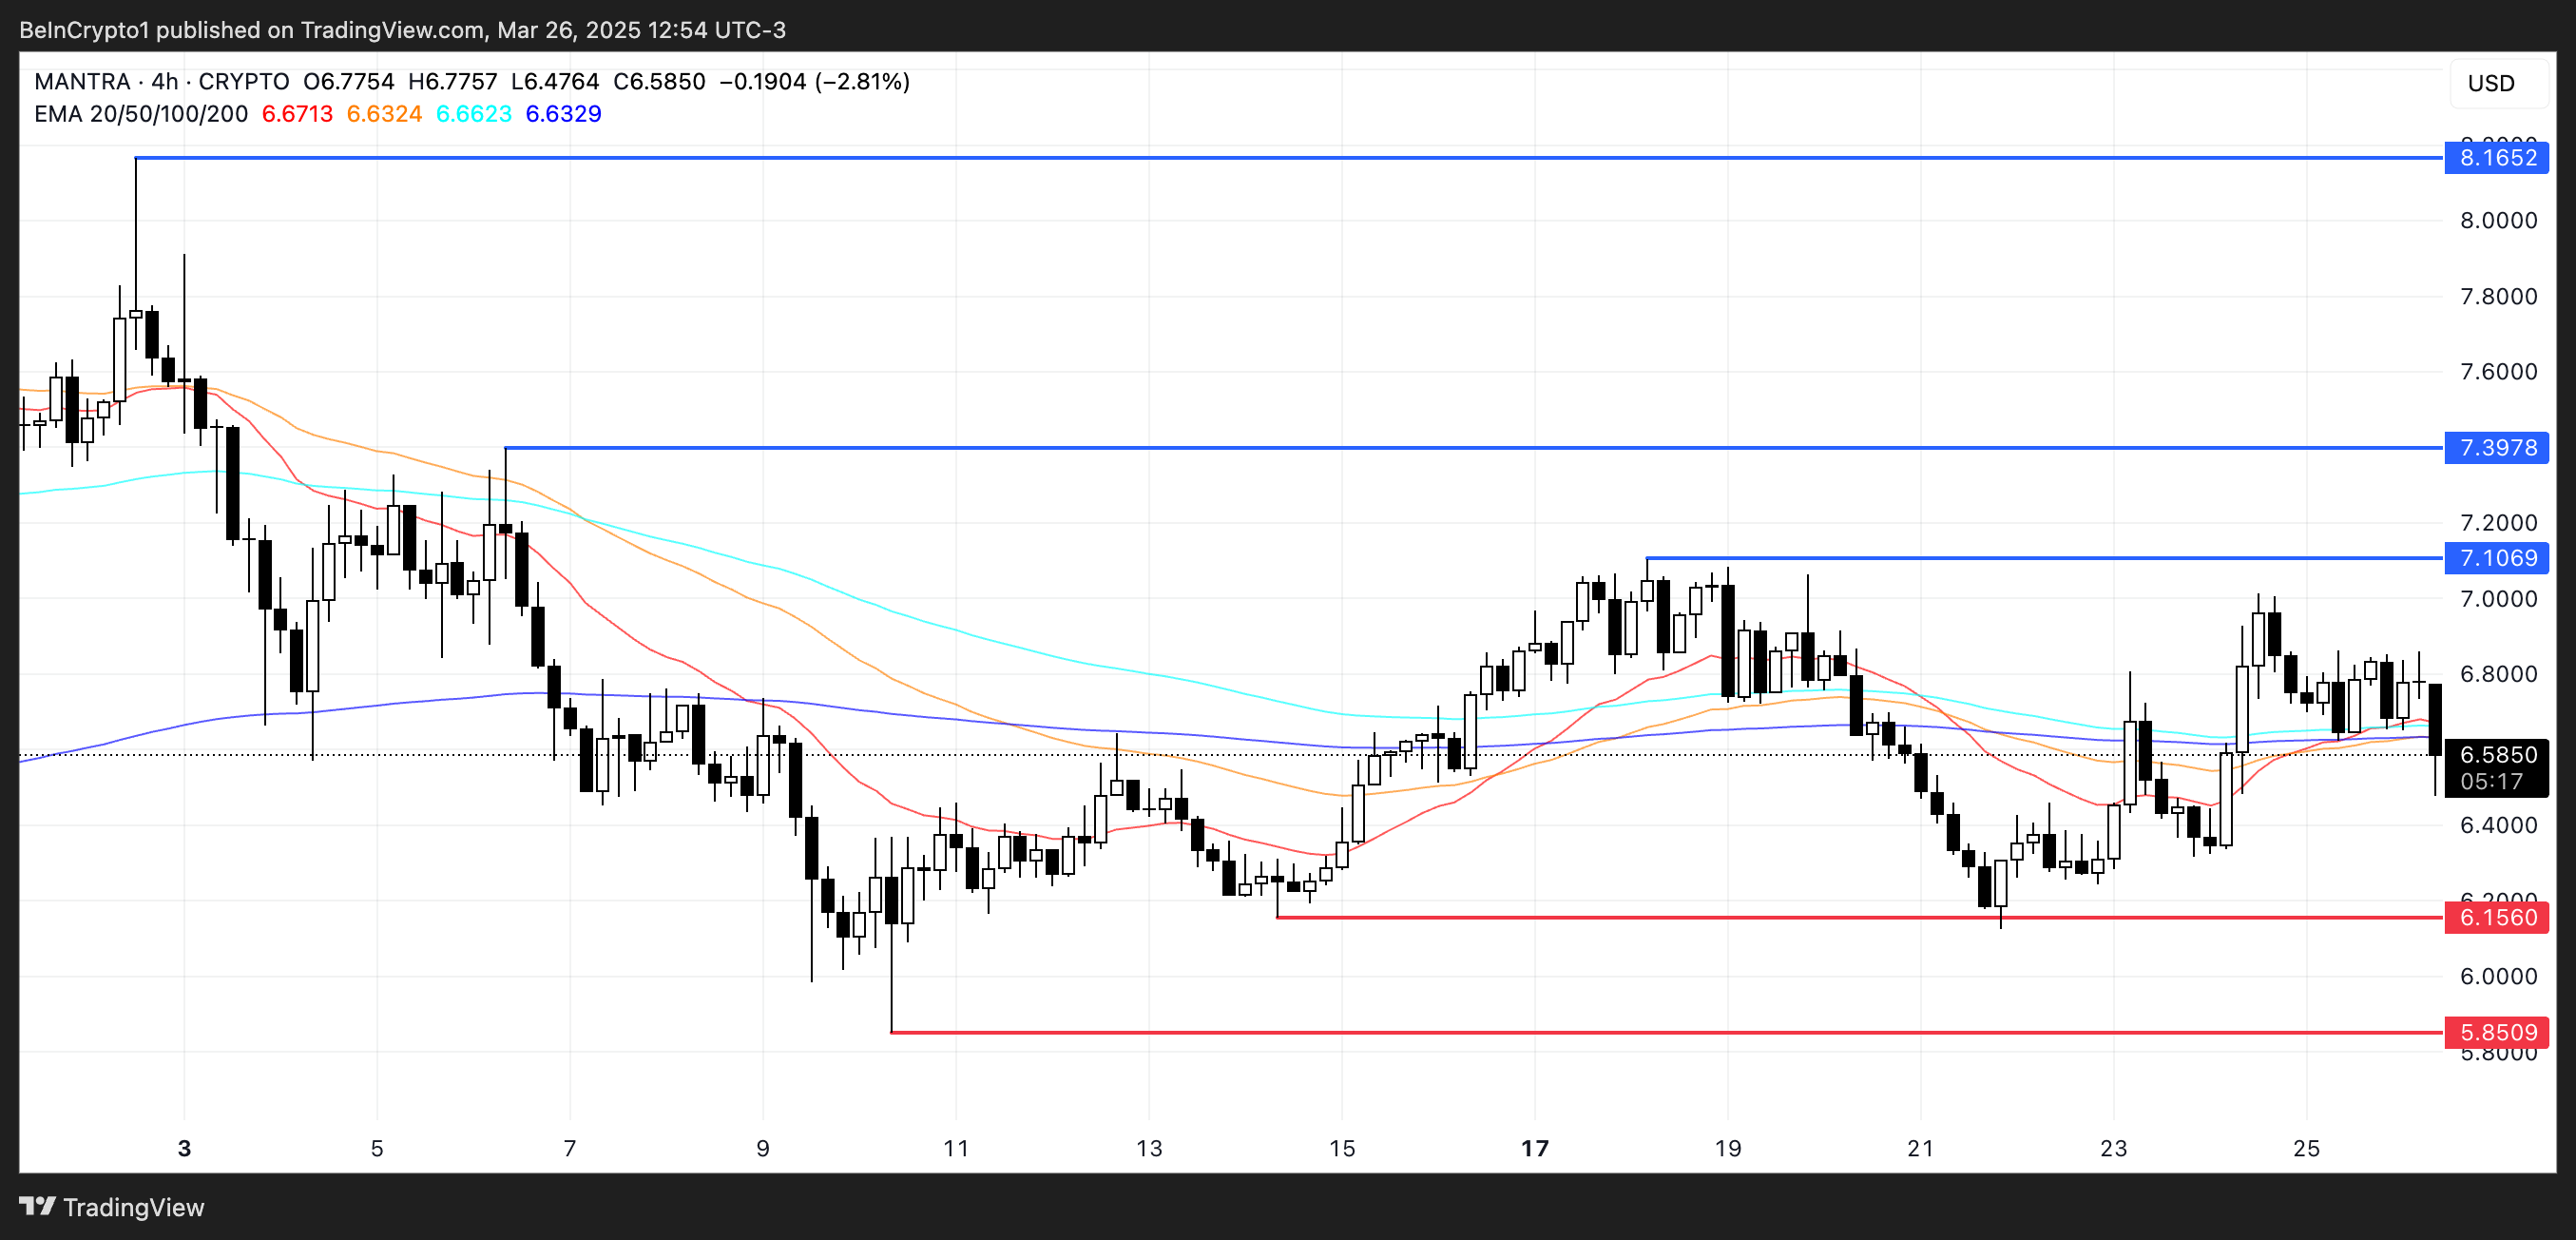
However, if sentiment towards RWA coins recovers, Mantra could see a trend reversal. In this case, OM could rise to the $7.10 resistance level, and if it breaks through, the next target would be $7.39.
If the upward movement reflects the strength of the previous few months, OM could rise above $8, testing $8.16 for the first time since the end of February.

