

Bitcoin appears to be starting April with a less bearish atmosphere, with the cryptocurrency market continuing to recover.
According to on-chain data, selling pressure among BTC holders is easing, which could pave the way for price increases in the coming weeks.
Bitcoin Short-Term Holders Show Confidence
Key on-chain indicators, including the Short-Term Holder Spent Output Profit Ratio (STH-SOPR), suggest that the number of coins being sold in the market is decreasing. At the time of reporting, this indicator was at 0.9, having steadily declined over the past week.
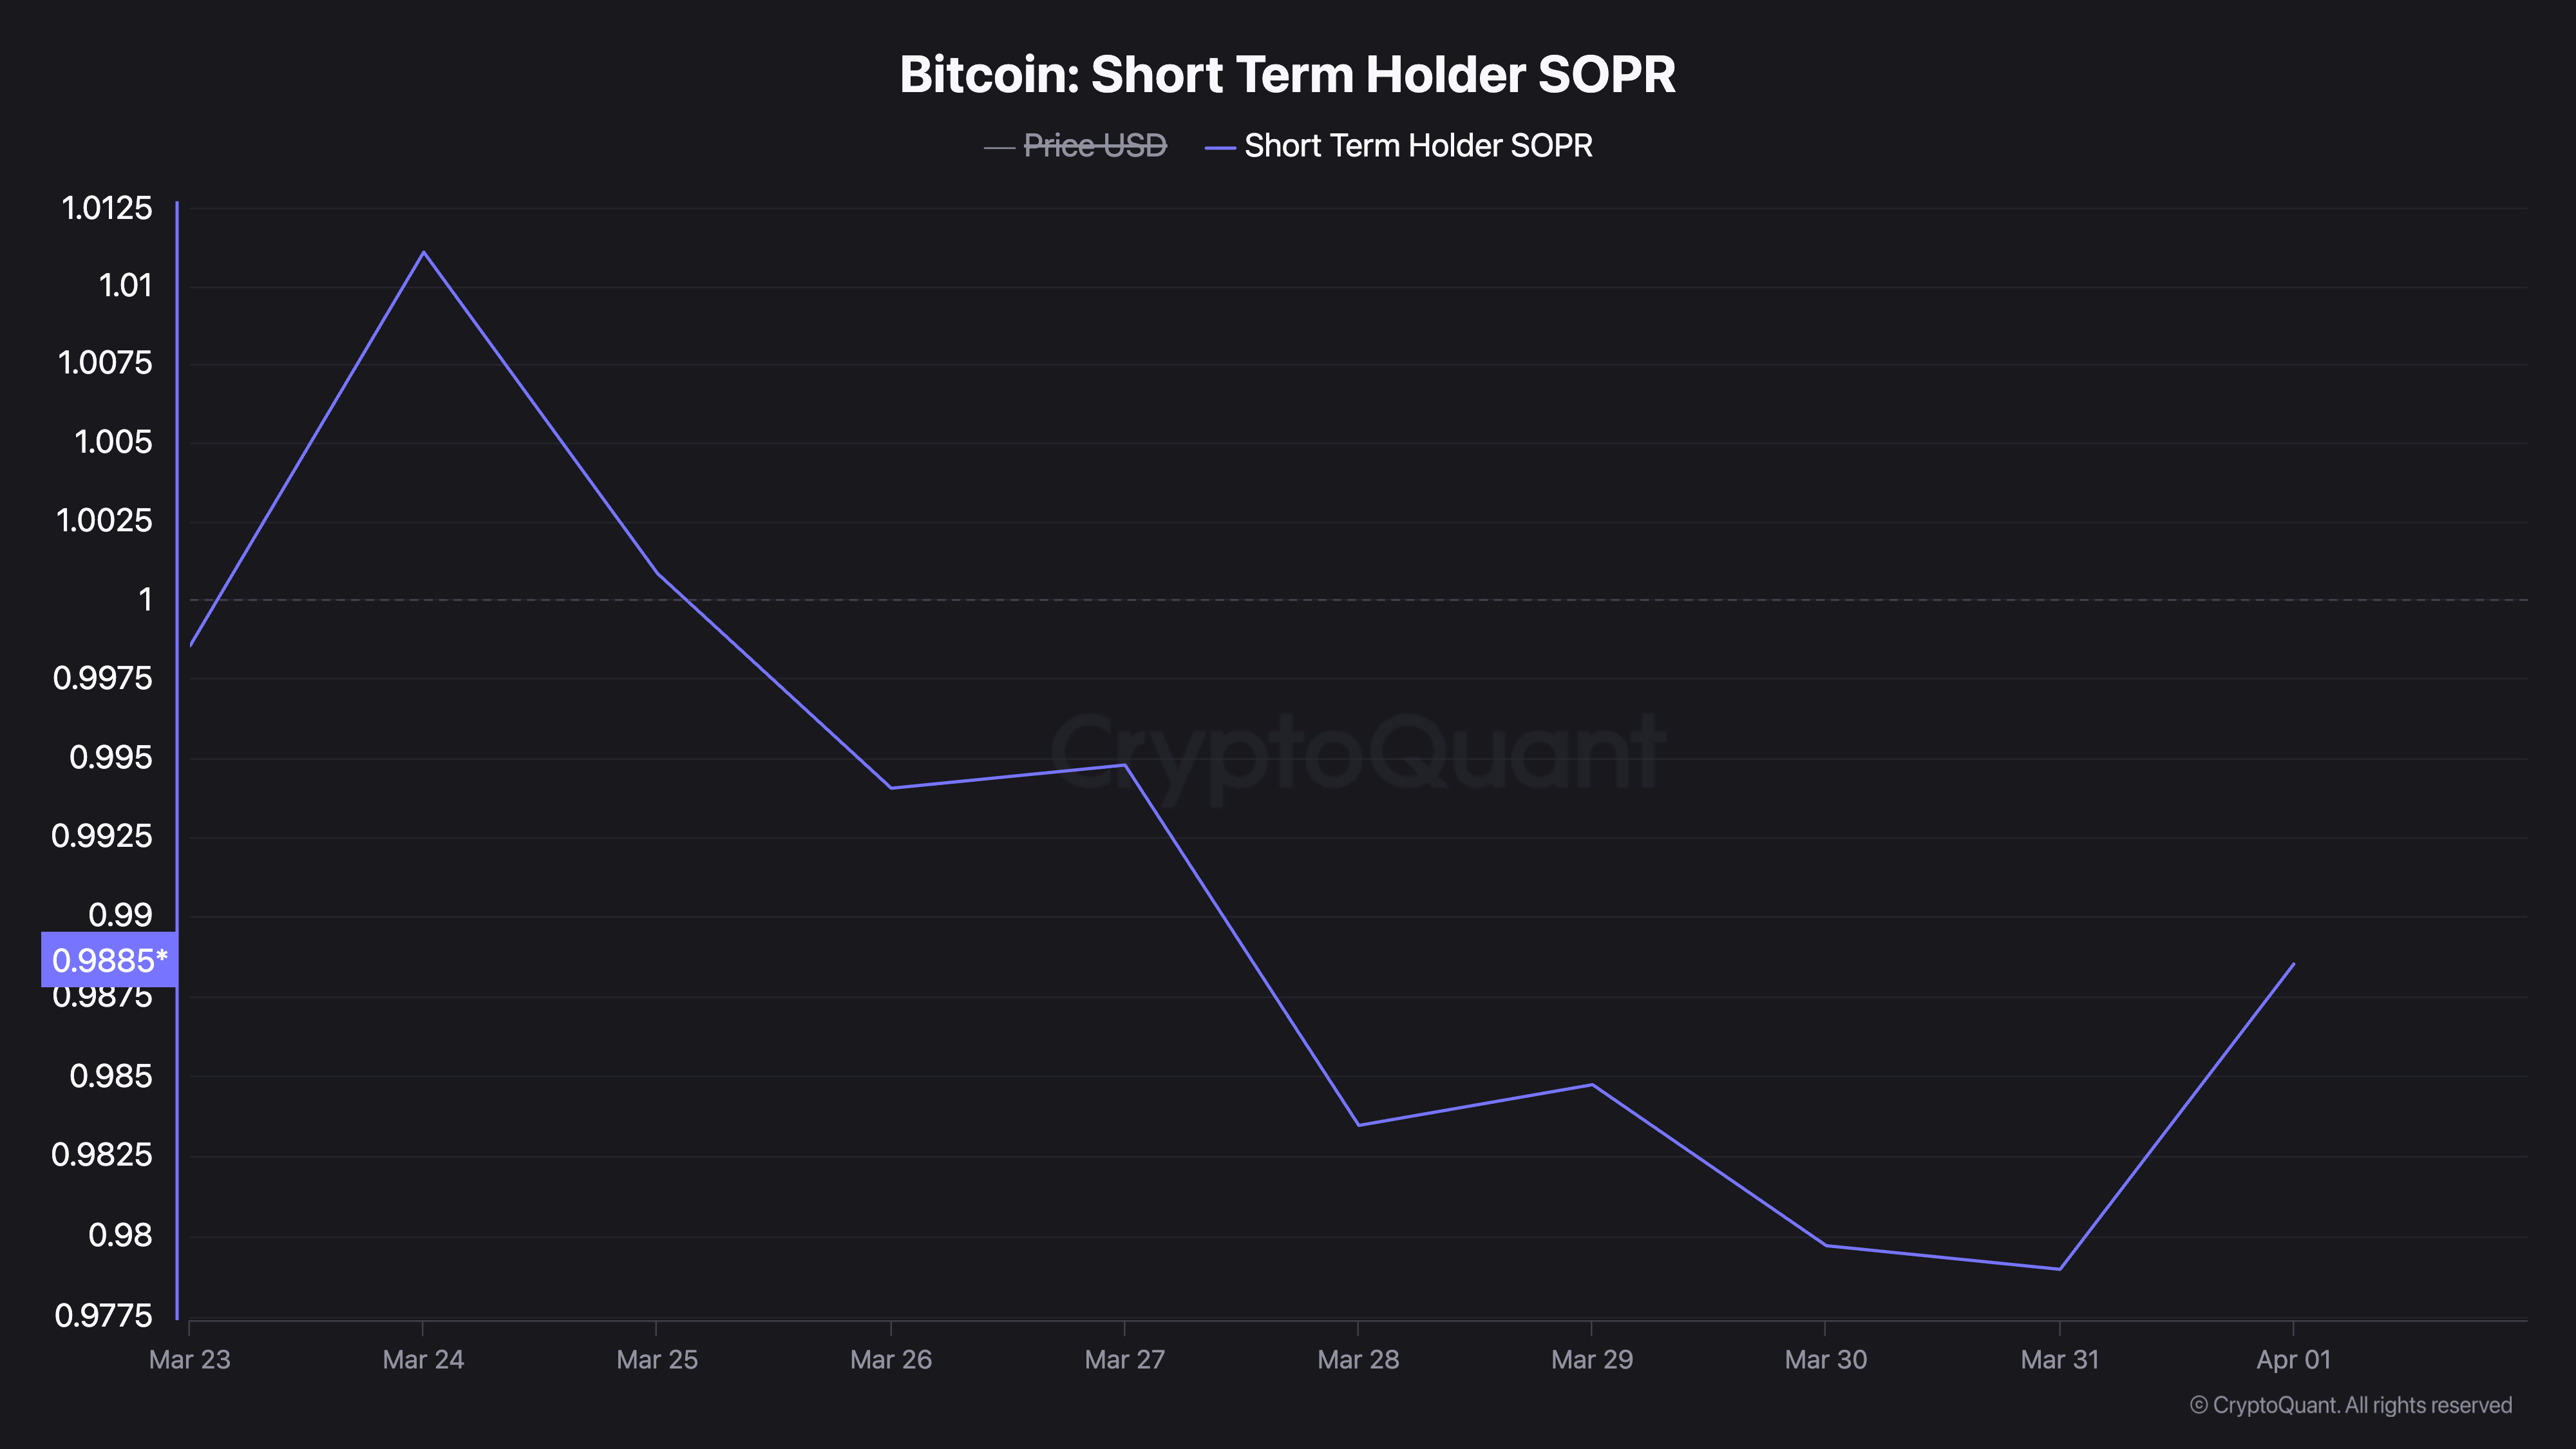
BTC's STH-SOPR measures the profitability of short-term holders (those who have held coins for 3-6 months), providing insights into whether these investors are making profits or experiencing losses.
When STH-SOPR is above 1, it typically indicates that these holders are selling coins at a profit. Conversely, when STH-SOPR is below 1, it suggests that these holders are experiencing losses.
In a situation where holders are holding unrealized losses, they have no motivation to sell their assets. This reduces selling pressure in the market and could increase its value as positive sentiment returns.
Long-Term Holders Decrease Selling
Additionally, the decrease in Bitcoin's Value Days Destroyed (VDD) confirms a gradual shift in positive sentiment for this key coin. In a recent report, anonymous CryptoQuant analyst Banker noted that this indicator plummeted in March, indicating a decrease in selling among BTC long-term holders.
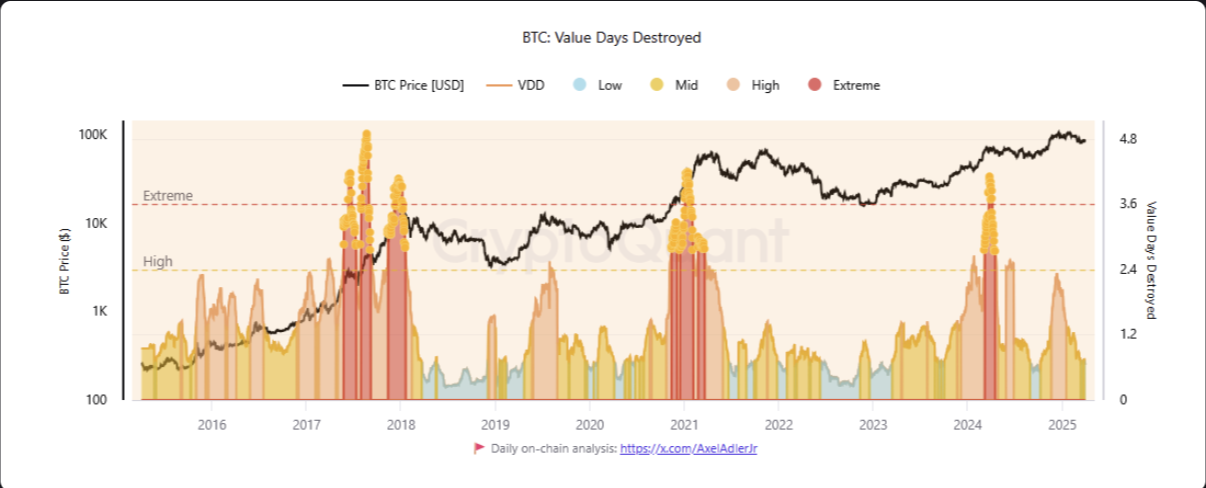
Bitcoin's VDD tracks accumulation and distribution patterns among long-term coin holders. A rise in VDD indicates old coins are moving, suggesting long-term holders are selling or realizing profits.
Conversely, a decrease in BTC's VDD indicates that these holders continue to hold coins, signifying strong conviction and belief in future price increases.
According to Banker, BTC's VDD spiked to 2.27 on December 12th, indicating that "long-term holders were aggressively realizing profits, a classic warning sign of potential market overheating." However, in March, this indicator dropped to 0.65, suggesting the intense profit-taking phase has passed and these holders are now showing more restraint.
"The subsequent decline to 0.65 by March 2025 tells a meaningful story. This steady three-month decline suggests the most intense profit-taking phase has passed, and long-term holders are now showing more restraint. This reduces immediate selling pressure but indicates the market is entering a new cycle stage," Banker mentioned.
As these indicators highlight, increased holder confidence could push BTC to new highs. This will further solidify its market position as investor sentiment gradually turns positive.
BTC RSI Breakthrough, Price Potential of $87,000-$91,000
On the daily chart, BTC is attempting to break through the neutral line of the Relative Strength Index (RSI), reflecting a surge in buying activity. At the time of reporting, this key momentum indicator is located at 47.10.
The RSI measures overbought and oversold market conditions for an asset. Ranging from 0 to 100, values above 70 indicate an asset is overbought and likely to decline. Conversely, values below 30 suggest the asset is oversold and may rebound.
BTC's attempt to break through the 50 neutral line indicates strengthening bullish momentum as more buying pressure enters the market. This potential crossover could signal the start of an uptrend or a transition to positive price movement for the key coin.
In this scenario, its value could rise above the resistance level of $87,775 to reach $91,531.
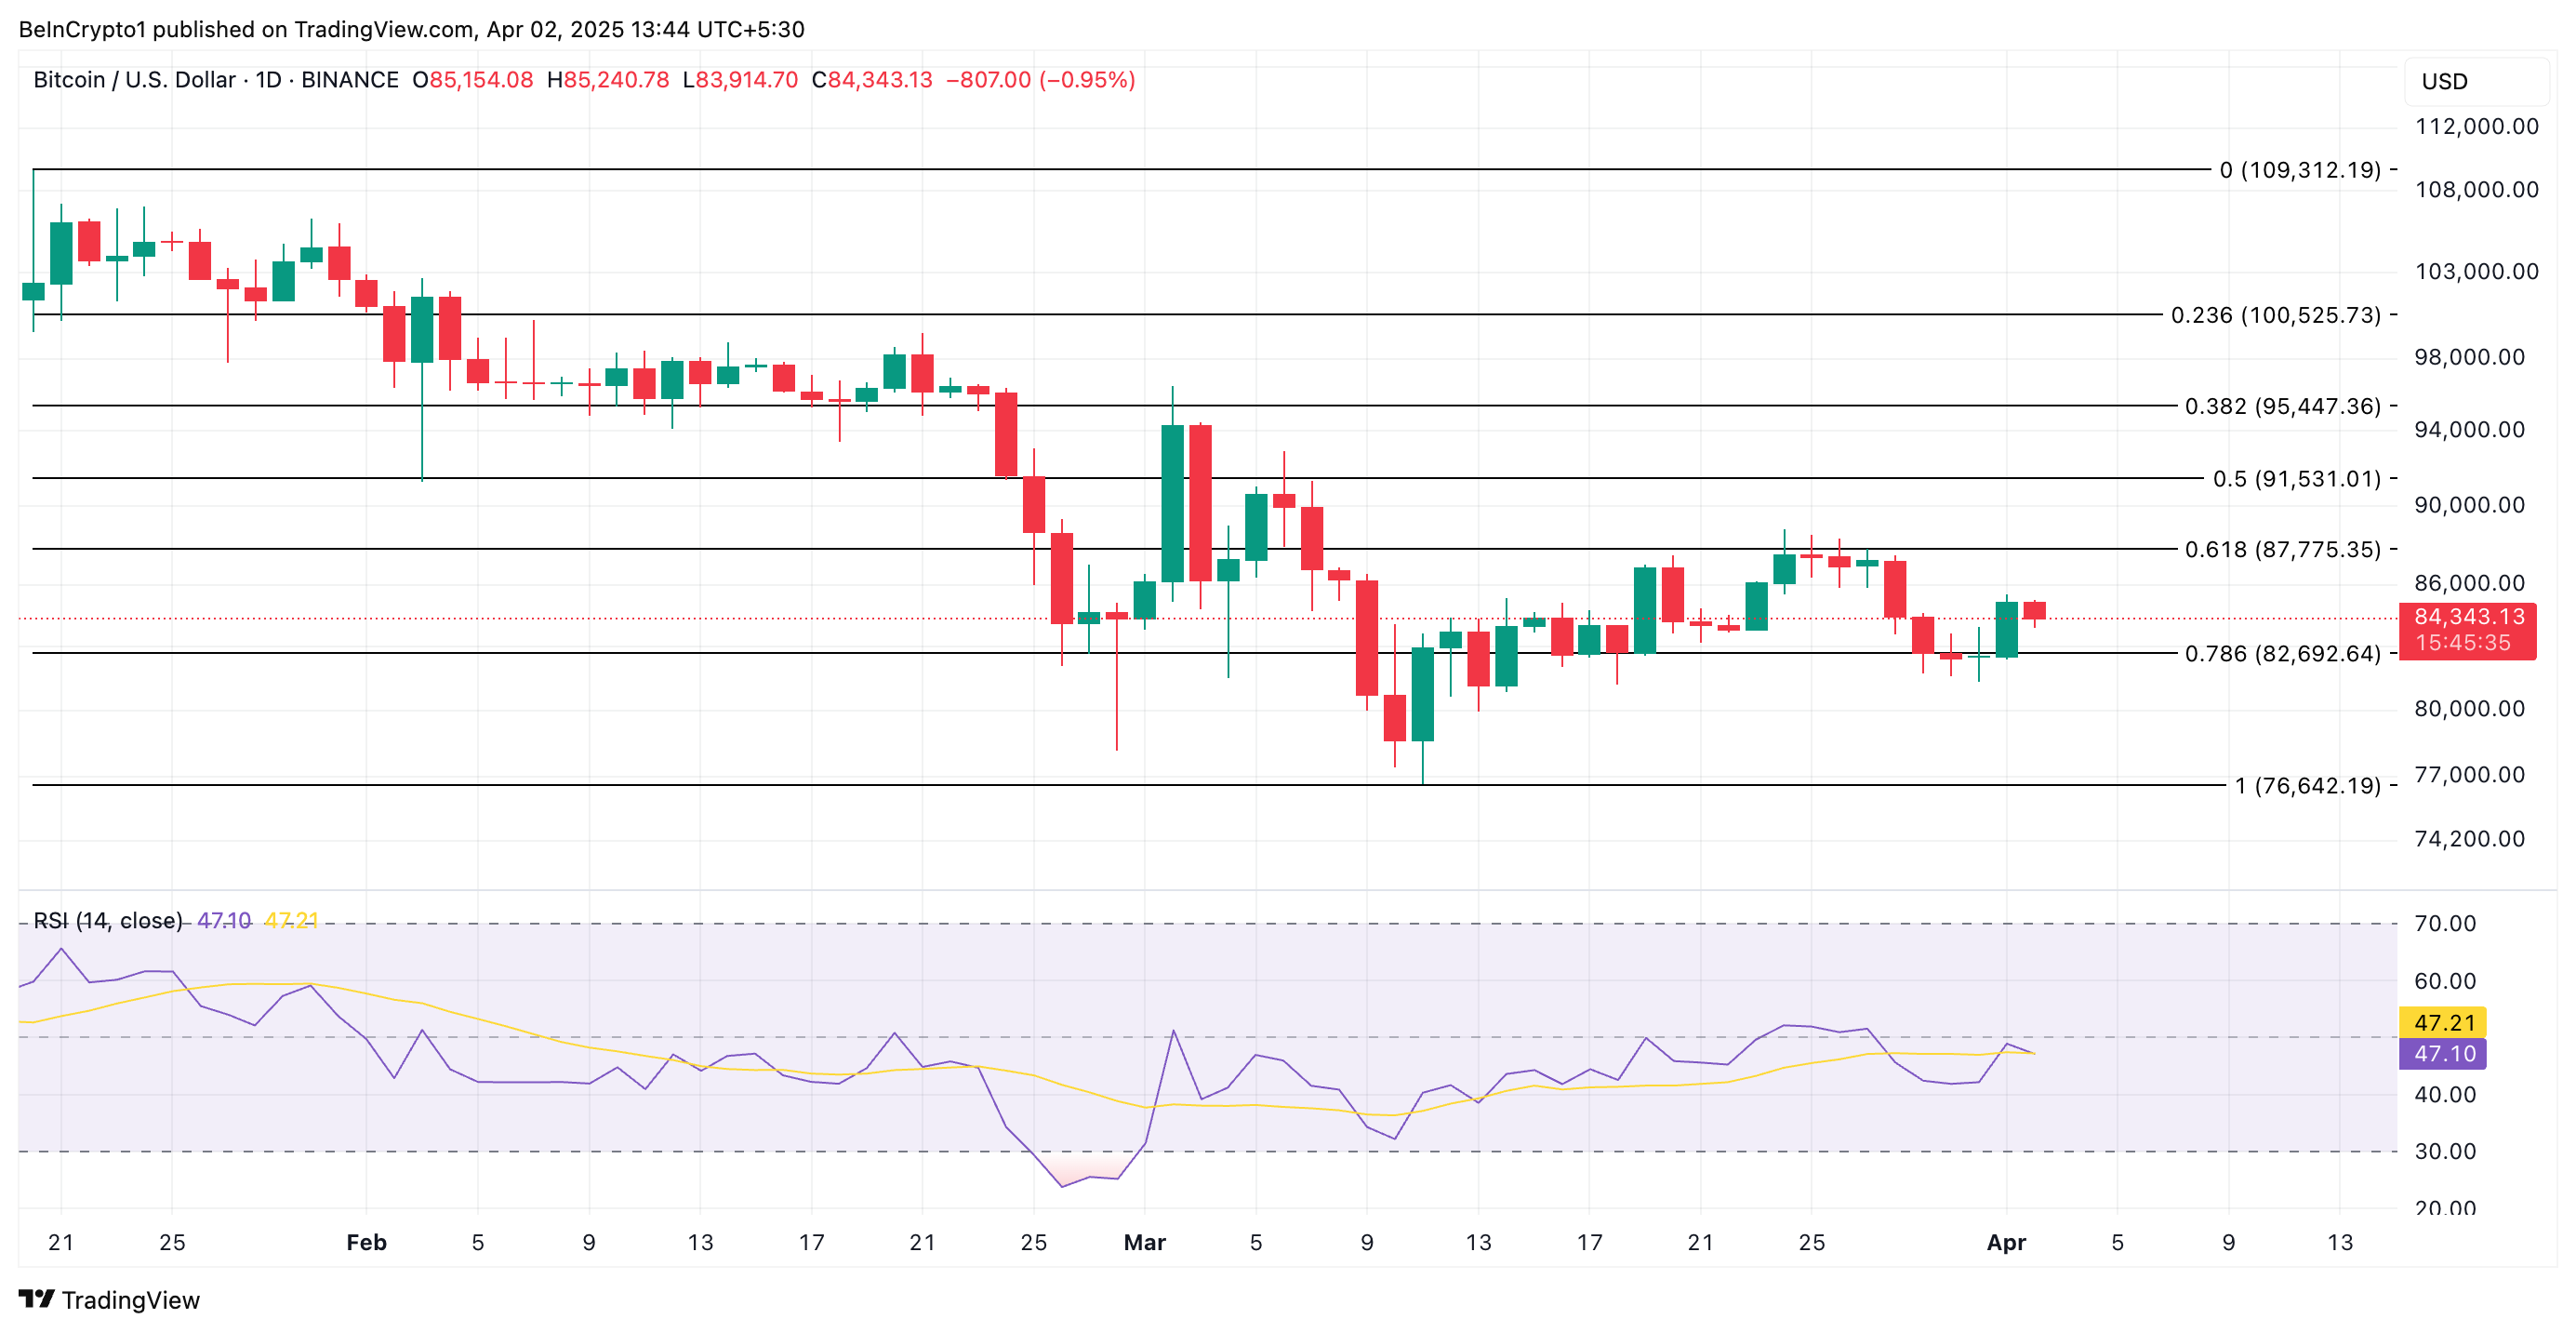
Conversely, if bearish sentiment reappears, the coin's price could resume its downward trend, falling to $82,692.


