

Bitcoin (BTC) rose by about 6% in the past 24 hours after Trump announced a 90-day tariff exemption for most countries except China. However, technical indicators suggest that while buyers are increasing, the upward trend may not be strong.
The DMI shows that positive pressure is increasing, but the overall trend is weakening. Meanwhile, the EMA structure has not confirmed a complete reversal, leaving open the possibility of additional increases or potential adjustments if momentum stops.
Bitcoin DMI, Buyer Dominance... But Not a Strong Trend
Bitcoin's Directional Movement Index (DMI) chart shows a clear change in momentum. The ADX (Average Directional Index), which measures trend strength, dropped from 29.56 to 19.48 three days ago, indicating a weakening trend.
An ADX above 25 indicates a strong trend (up or down), while below 20 suggests the market is consolidating or lacks a clear direction. With the ADX now falling below 20, Bitcoin may be entering a period of reduced volatility and uncertainty.
Looking deeper into the components, the +DI (Positive Directional Indicator) is currently at 28.41, having sharply risen from 20.84 yesterday after Trump's 90-day tariff exemption announcement.
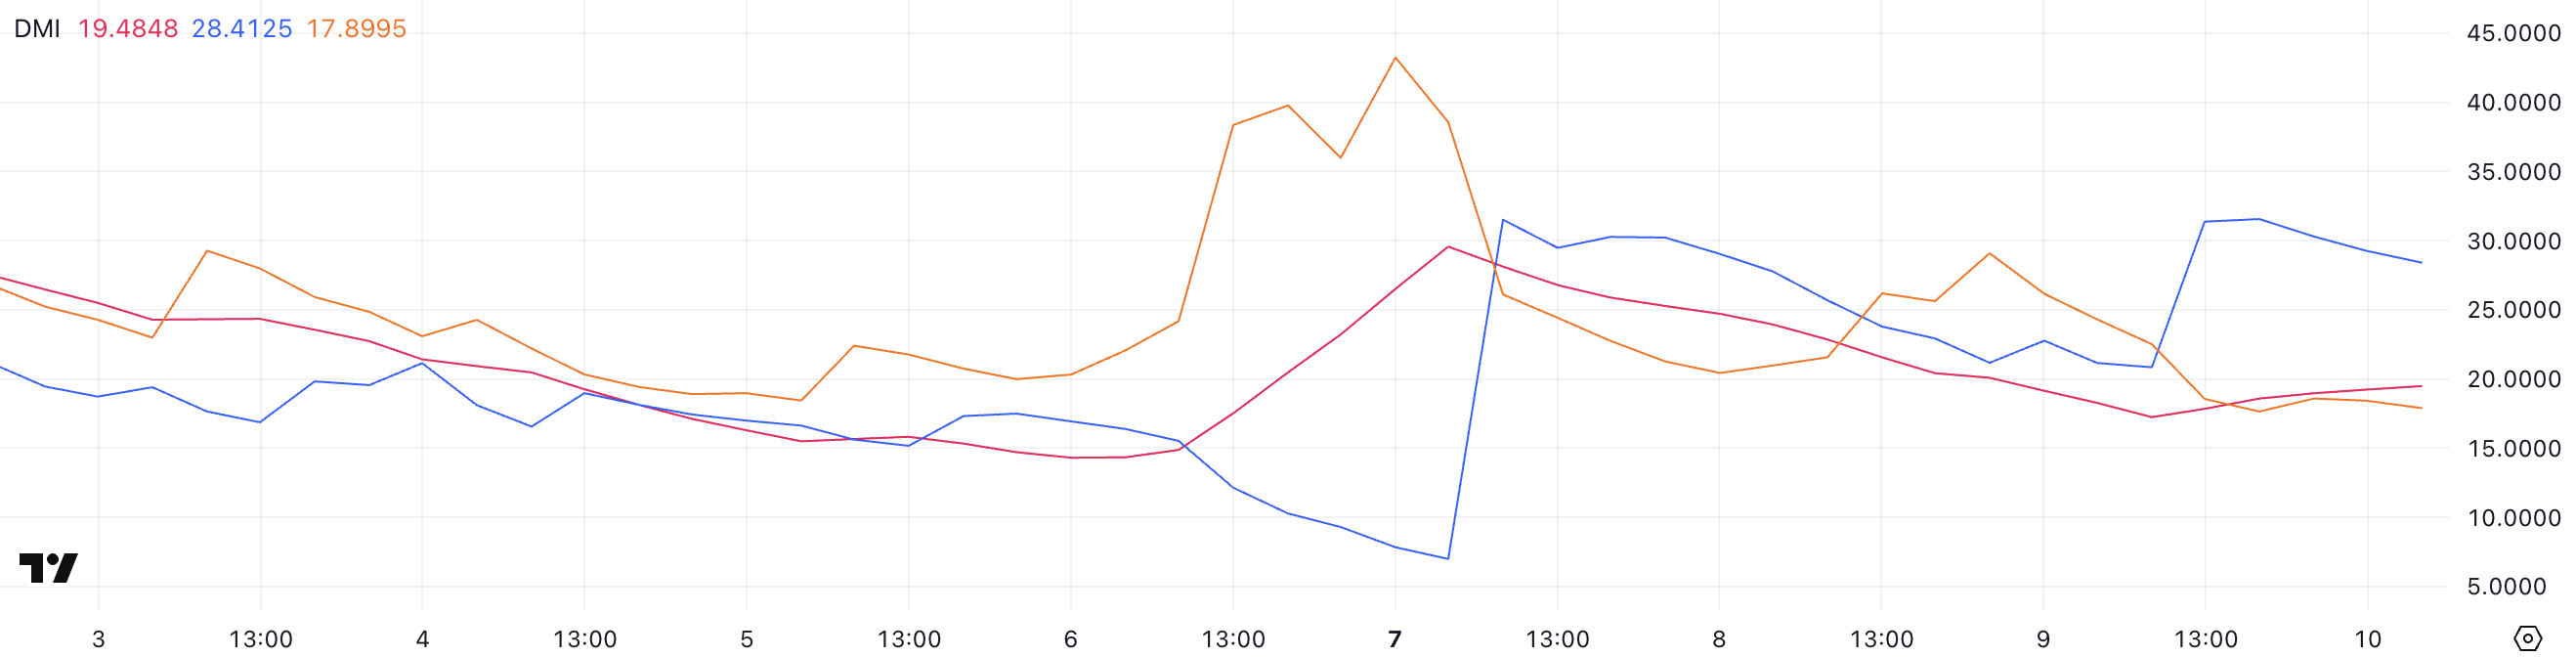
This suggests increasing upward pressure. Meanwhile, the -DI (Negative Directional Indicator) dropped from 29 to 17.89 two days ago, indicating weakening downward momentum.
The +DI's sharp rise could be encouraging, but its retreat from a high of 31.55 just hours ago implies that the initial upward reaction is cooling.
Overall, despite signs of buying strength, the ADX's decline and +DI's retreat suggest that BTC may lack confidence in continuing its short-term breakthrough.
BTC Ichimoku Cloud, Cautious Optimism
Bitcoin's current Ichimoku Cloud setup shows a mixed but cautiously optimistic structure. The price movement is positioned just above the red cloud (Kumo), suggesting a recent breakthrough.
However, this breakthrough still lacks strong confidence, with the forward cloud being flat and relatively thin, indicating weak momentum and potential resistance.
The Leading Span A (green line forming the top of the future cloud) is slightly tilted upward, but the lack of separation from Span B (red line forming the bottom of the cloud) suggests limited upward strength for now.
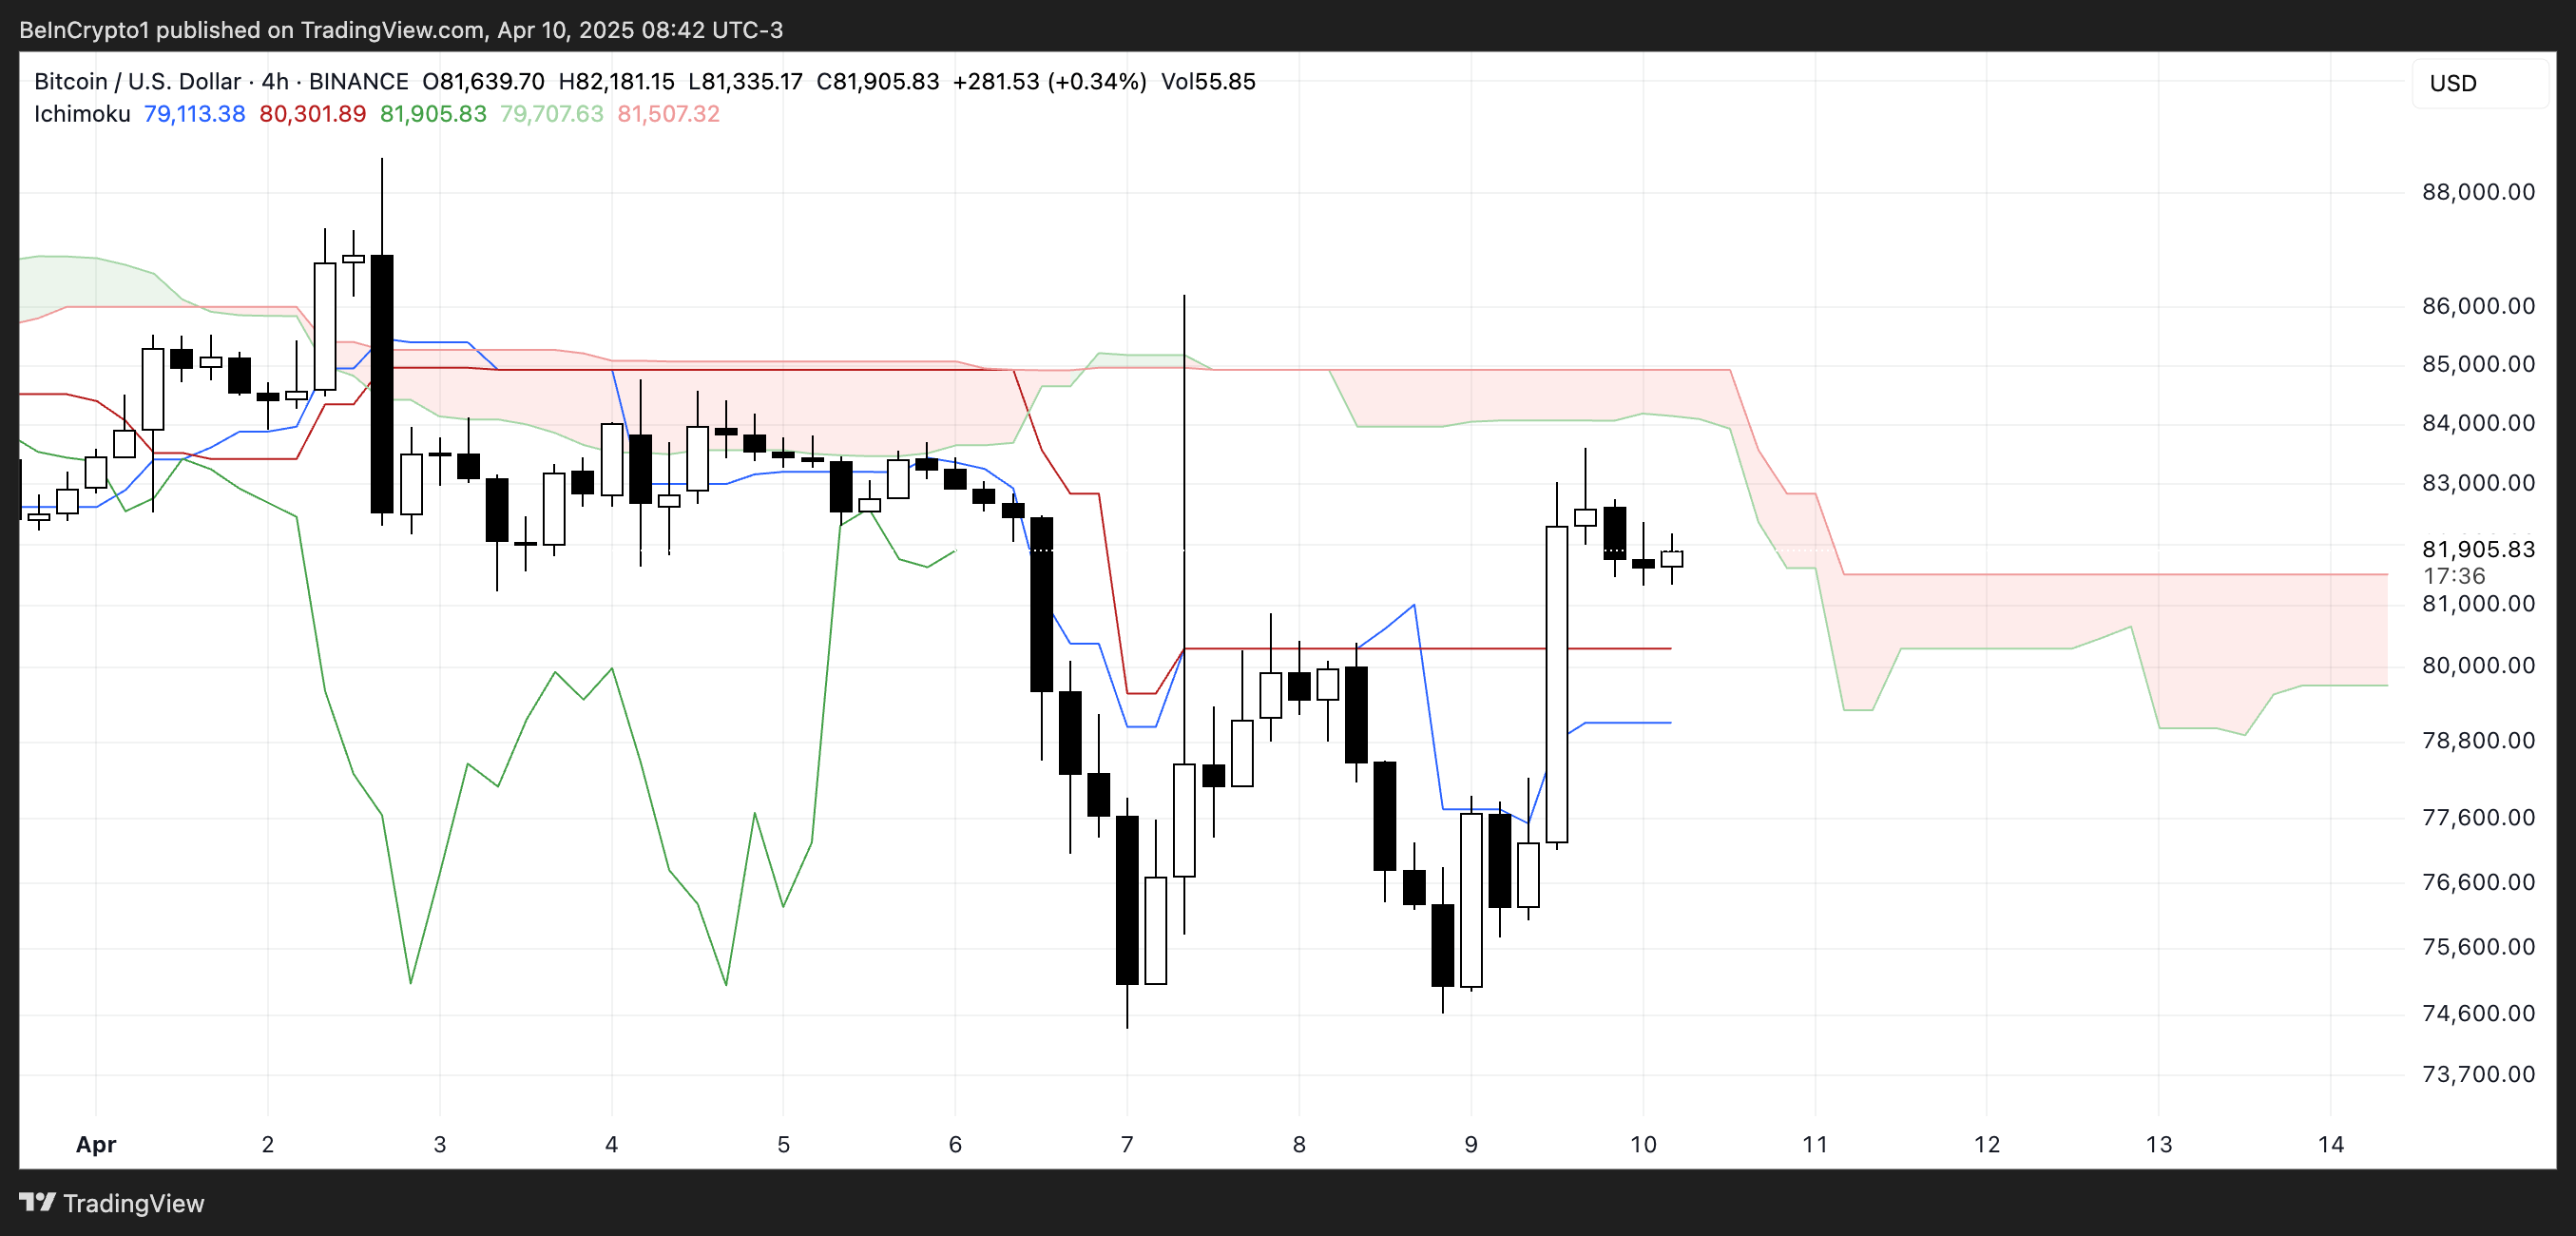
The Conversion Line (blue line) and Base Line (red line) recently experienced an upward crossover, with the Conversion Line rising above the Base Line, which is traditionally a positive signal in Ichimoku Cloud interpretation.
However, the Base Line's flat nature and price adjustment just above the cloud may indicate that Bitcoin is entering a short-term balance state rather than preparing for strong continuation.
The Lagging Span (delayed green line) is now above the price candles and cloud, supporting an upward bias, but only if follow-up actions occur.
Overall, the structure is tilted towards an increase, but thin clouds and lack of strong momentum call for caution until more definitive signals emerge.
Will Bitcoin Continue to Rise in the Next Few Days?
Despite Bitcoin's recent upward movement, the EMA (Exponential Moving Average) structure continues to show a downward trend, with short-term exponential moving averages remaining below long-term moving averages.
This alignment typically indicates ongoing downward pressure, despite short-term rallies.
However, if current momentum continues and a golden cross forms, with short-term EMAs crossing above long-term EMAs, it could signal a change in trend strength.

Such a breakthrough could open a path to test resistance levels, with potential upside targets at $85,124. If breached, further increases could reach $88,839 and $92,920.
Nevertheless, Bitcoin remained unchanged after the US CPI (Consumer Price Index) report, which showed inflation had eased last month.
Meanwhile, analysts are maintaining a cautious stance on whether the recent rebound is merely a short-term bounce. If Bitcoin fails to confirm a trend reversal, the price may retreat to test support near $79,955.
Losing that level could push Bitcoin's price into a deeper correction towards $76,642. If macro uncertainties re-emerge, such as tariff pressures from the Trump administration resuming, risk-averse sentiment could worsen, potentially driving BTC down to $74,389.


