

Yesterday, Mantra (OM) experienced a massive 90% collapse and continues to decline today. In particular, OM's chart and indicators look as bad as the Terra LUNA collapse in 2022.
OM's RSI remains at an extremely oversold level, showing almost no buying activity. When LUNA collapsed, many traders bought in for a short-term surge, but according to the current chart, such a possibility for Mantra seems low.
OM RSI Drops Below 10
After collapsing by over 90% in just a few hours, some traders may view Mantra's OM token as a "buy the dip" opportunity.
However, the Relative Strength Index (RSI) tells a different story. OM's RSI plummeted from 45 to 4 during the collapse and has slightly recovered to 10.85.
RSI is a momentum indicator that measures the speed and magnitude of price changes on a scale from 0 to 100. Generally, values below 30 indicate an oversold state, while values above 70 suggest an asset is overbought.
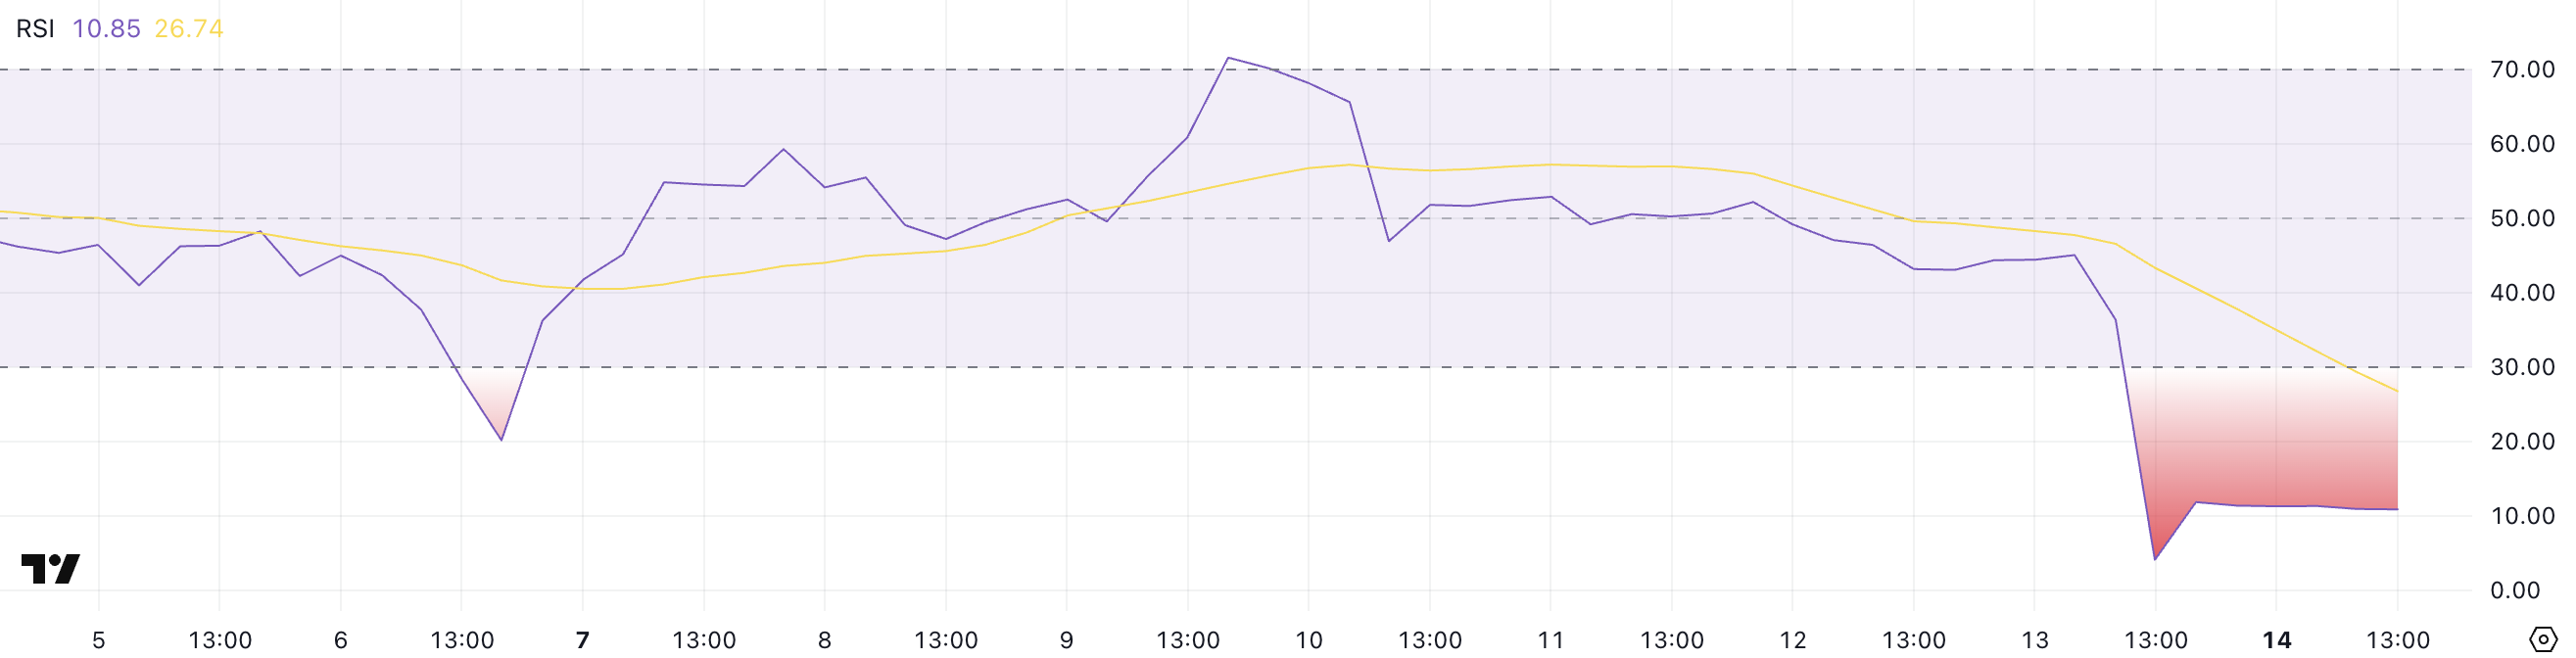
Despite rebounding from an extreme low, OM's RSI has remained near 10.85 for several hours, indicating almost no buyers to support the price.
This lack of buying pressure shows that market sentiment remains strongly bearish, suggesting traders lack confidence to accumulate tokens even at this significantly discounted level.
In a recent interview with BeInCrypto, analysts warned about the potential lack of true on-chain value for Mantra.
OM may experience further decline or long-term stagnation while the market awaits a catalyst or clear recovery signal.
Mantra DMI Shows Almost No Buying Activity
Mantra's DMI (Directional Movement Index) chart clearly shows a strong downward momentum. The ADX, which measures the trend's strength regardless of direction, is currently 47.23, far exceeding the 25 threshold with no signs of weakening.
The -DI, which tracks selling pressure, has decreased from a peak of 85.29 to 69.69, indicating panic selling may slow down but remains dominant.
Meanwhile, the +DI, which measures buying pressure, has dropped from 3.12 to 2.42, emphasizing a complete lack of bullish response to the collapse.
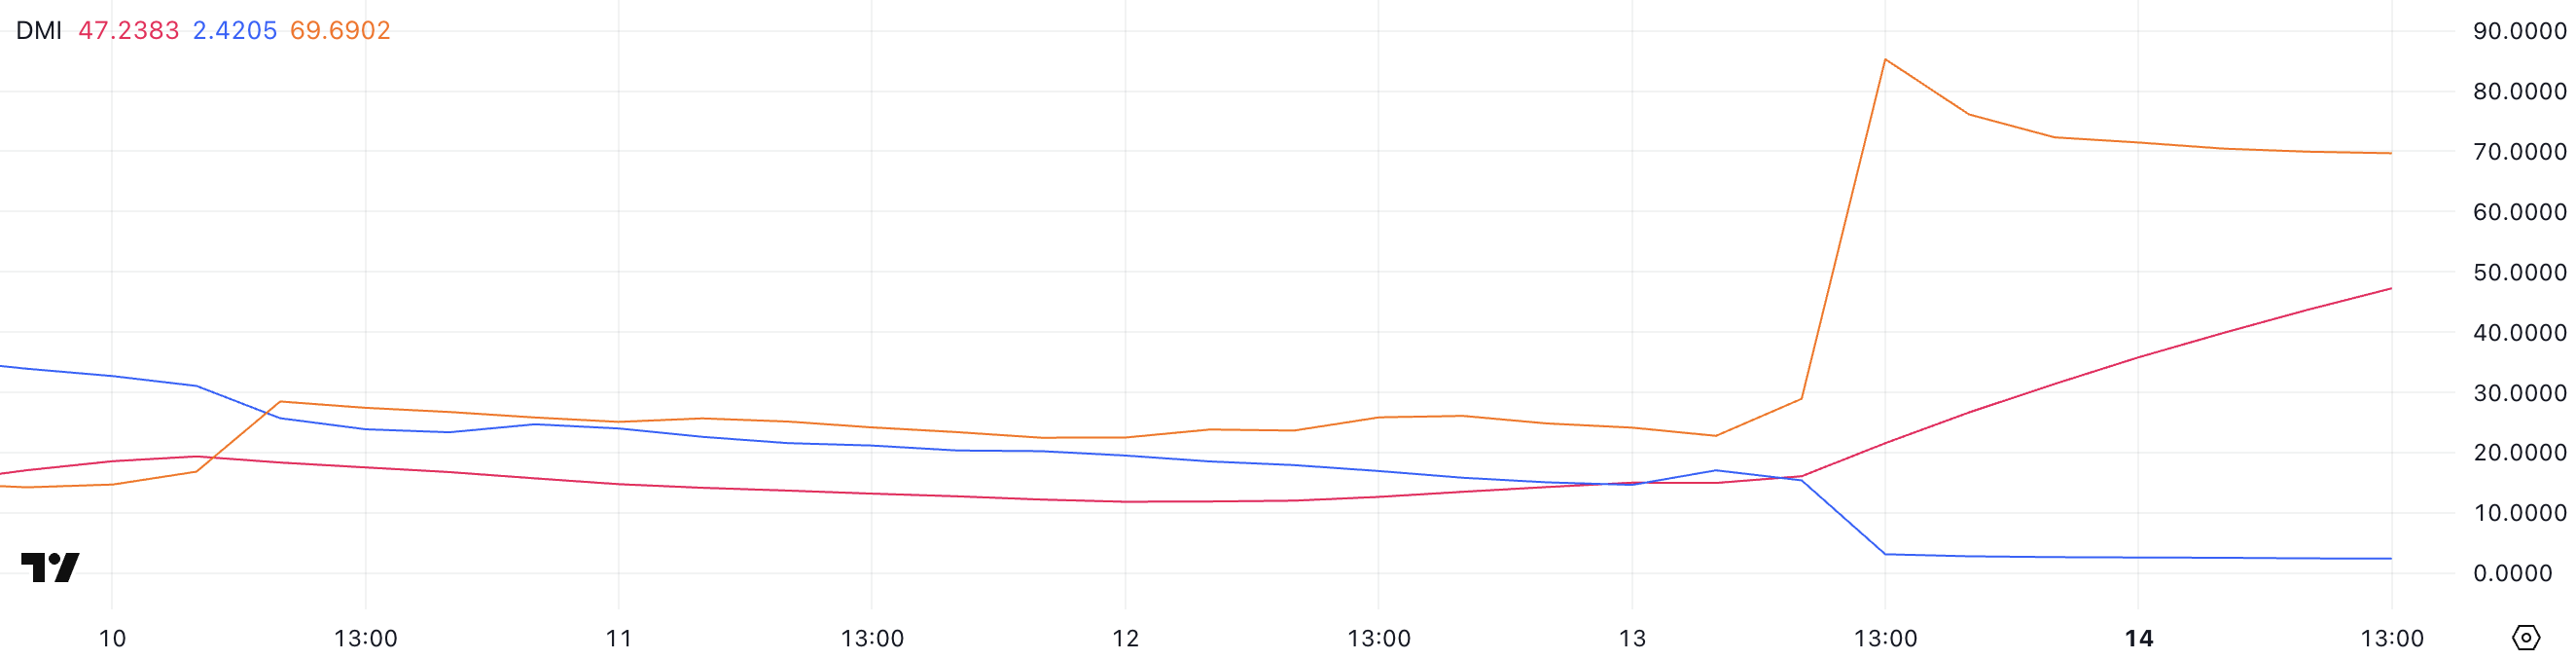
This imbalance reveals almost no meaningful buying activity to support OM's price, even if immediate selling has passed the worst-case scenario.
The fact that +DI remains very low suggests traders are still avoiding the token and hesitant to buy even after a massive discount.
As long as this dynamic continues—strong trend intensity, high selling pressure, and almost no buying pressure—OM is likely to remain under severe downward pressure, and recovery attempts will be extremely difficult unless market sentiment changes dramatically.

