

XRP rose by only 2% last week, indicating a decrease in buyers' interest in the short term.
XRP RSI, Loss of Buyer Control
XRP's Relative Strength Index (RSI) has fallen to 46.34, noticeably dropping from 57.30 the day before. This sharp movement suggests a clear change in momentum and indicates that buying pressure is cooling significantly in the short term.
When the RSI falls this quickly, it often suggests that traders are beginning to take profits or rotate positions, especially after a slight increase.
While XRP has not yet entered the oversold area, a drop below 50 is generally considered a bearish signal, suggesting a possible shift in sentiment from bullish to neutral or bearish.
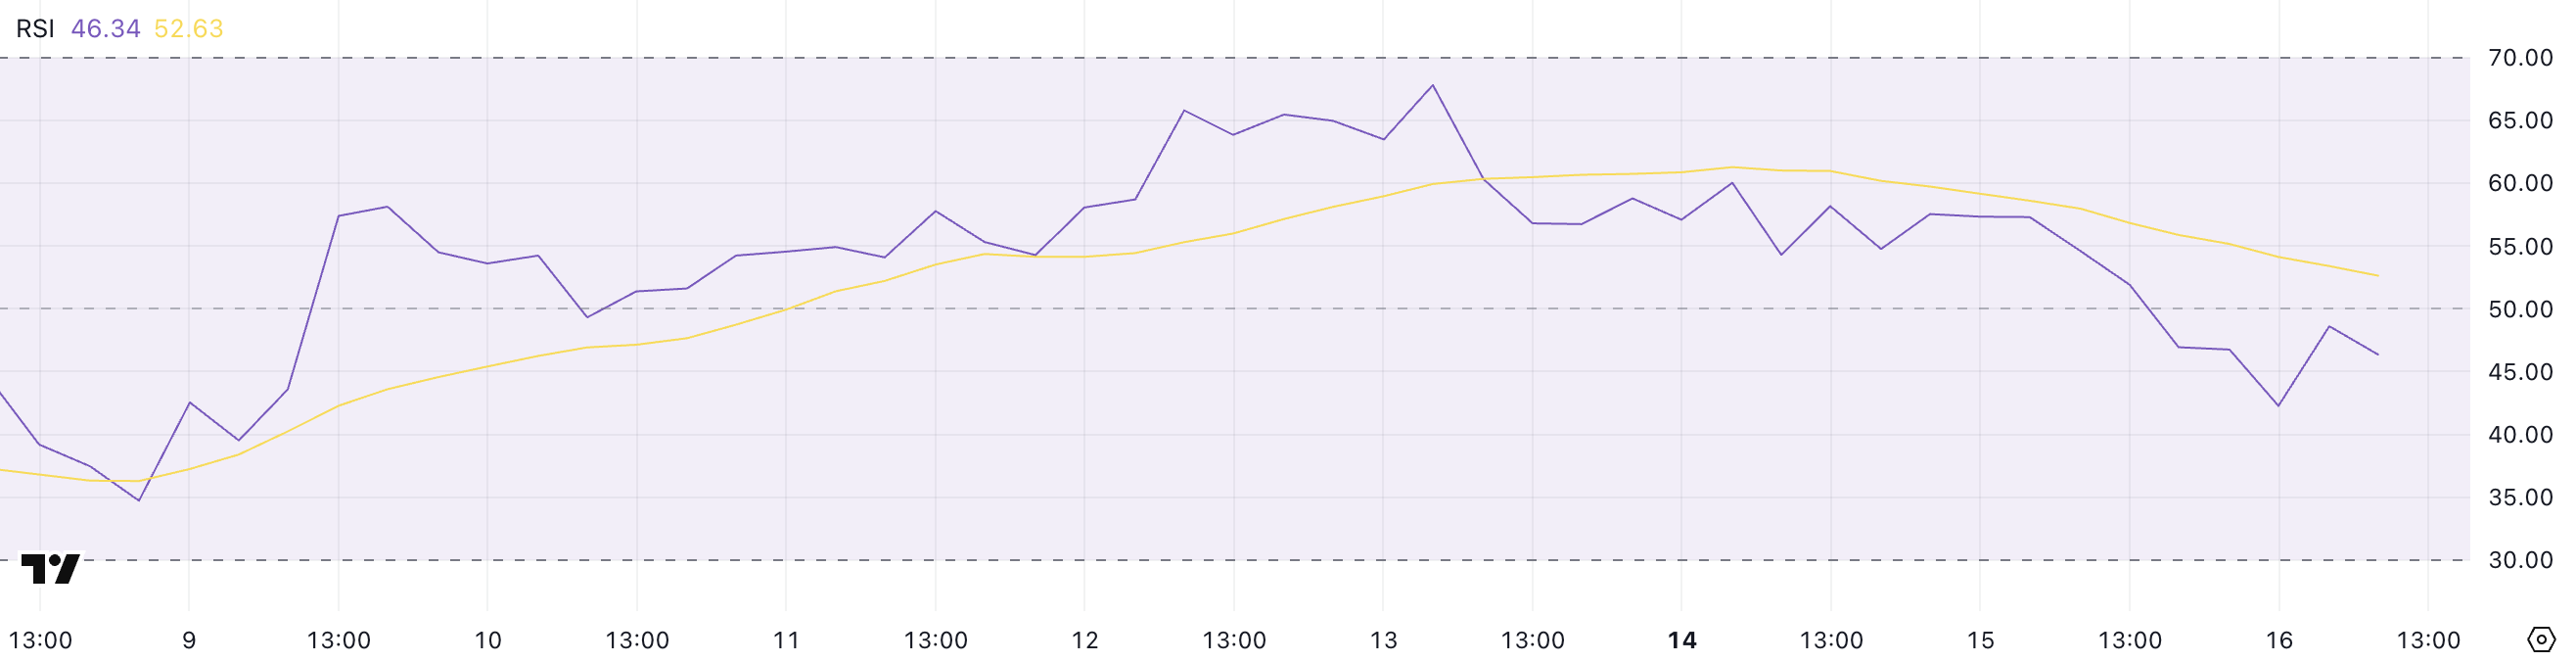
The RSI, or Relative Strength Index, is a widely used technical indicator that helps measure the strength of a price trend. It ranges from 0 to 100, with over 70 considered overbought and below 30 considered oversold.
When the RSI is above 50, it typically indicates an uptrend, and when below 50, it reflects increasing weakness. With XRP currently at 46.34, it suggests that the asset is losing upward momentum and may risk further decline if buying interest does not return soon.
If selling pressure continues and the RSI drops further, XRP may test key support levels in the near future.
XRP Ichimoku Cloud, Momentum Change
XRP's Ichimoku chart currently shows a transition to short-term bearish momentum.
The price has fallen below the blue conversion line and red baseline, which is generally considered a bearish signal.
When the price trades below these two lines, it indicates that momentum is weakening and the risk of decline increases if a quick recovery does not follow.

Additionally, the price is now entering the green cloud (Kumo), which represents an area of uncertainty or correction. The preceding cloud is relatively flat and wide, indicating potential support but also a lack of strong upward momentum.
The green Leading Span A remains above the red Leading Span B, indicating that the broader trend is still slightly bullish. However, if price movement remains within the cloud or falls below it, the trend could reverse.
Overall, the Ichimoku setup demands caution for buyers unless XRP definitively recovers the conversion and baseline.
Moving Averages, XRP Could Fall Below $2
XRP's moving averages are showing signs of weakness, with the XRP price repeatedly failing to break through resistance near $2.17, despite speculation about a potential partnership with Swift.
Repeated rejections at the same level indicate strong selling pressure. The moving averages suggest weakening momentum as the short-term average begins to curve downward.
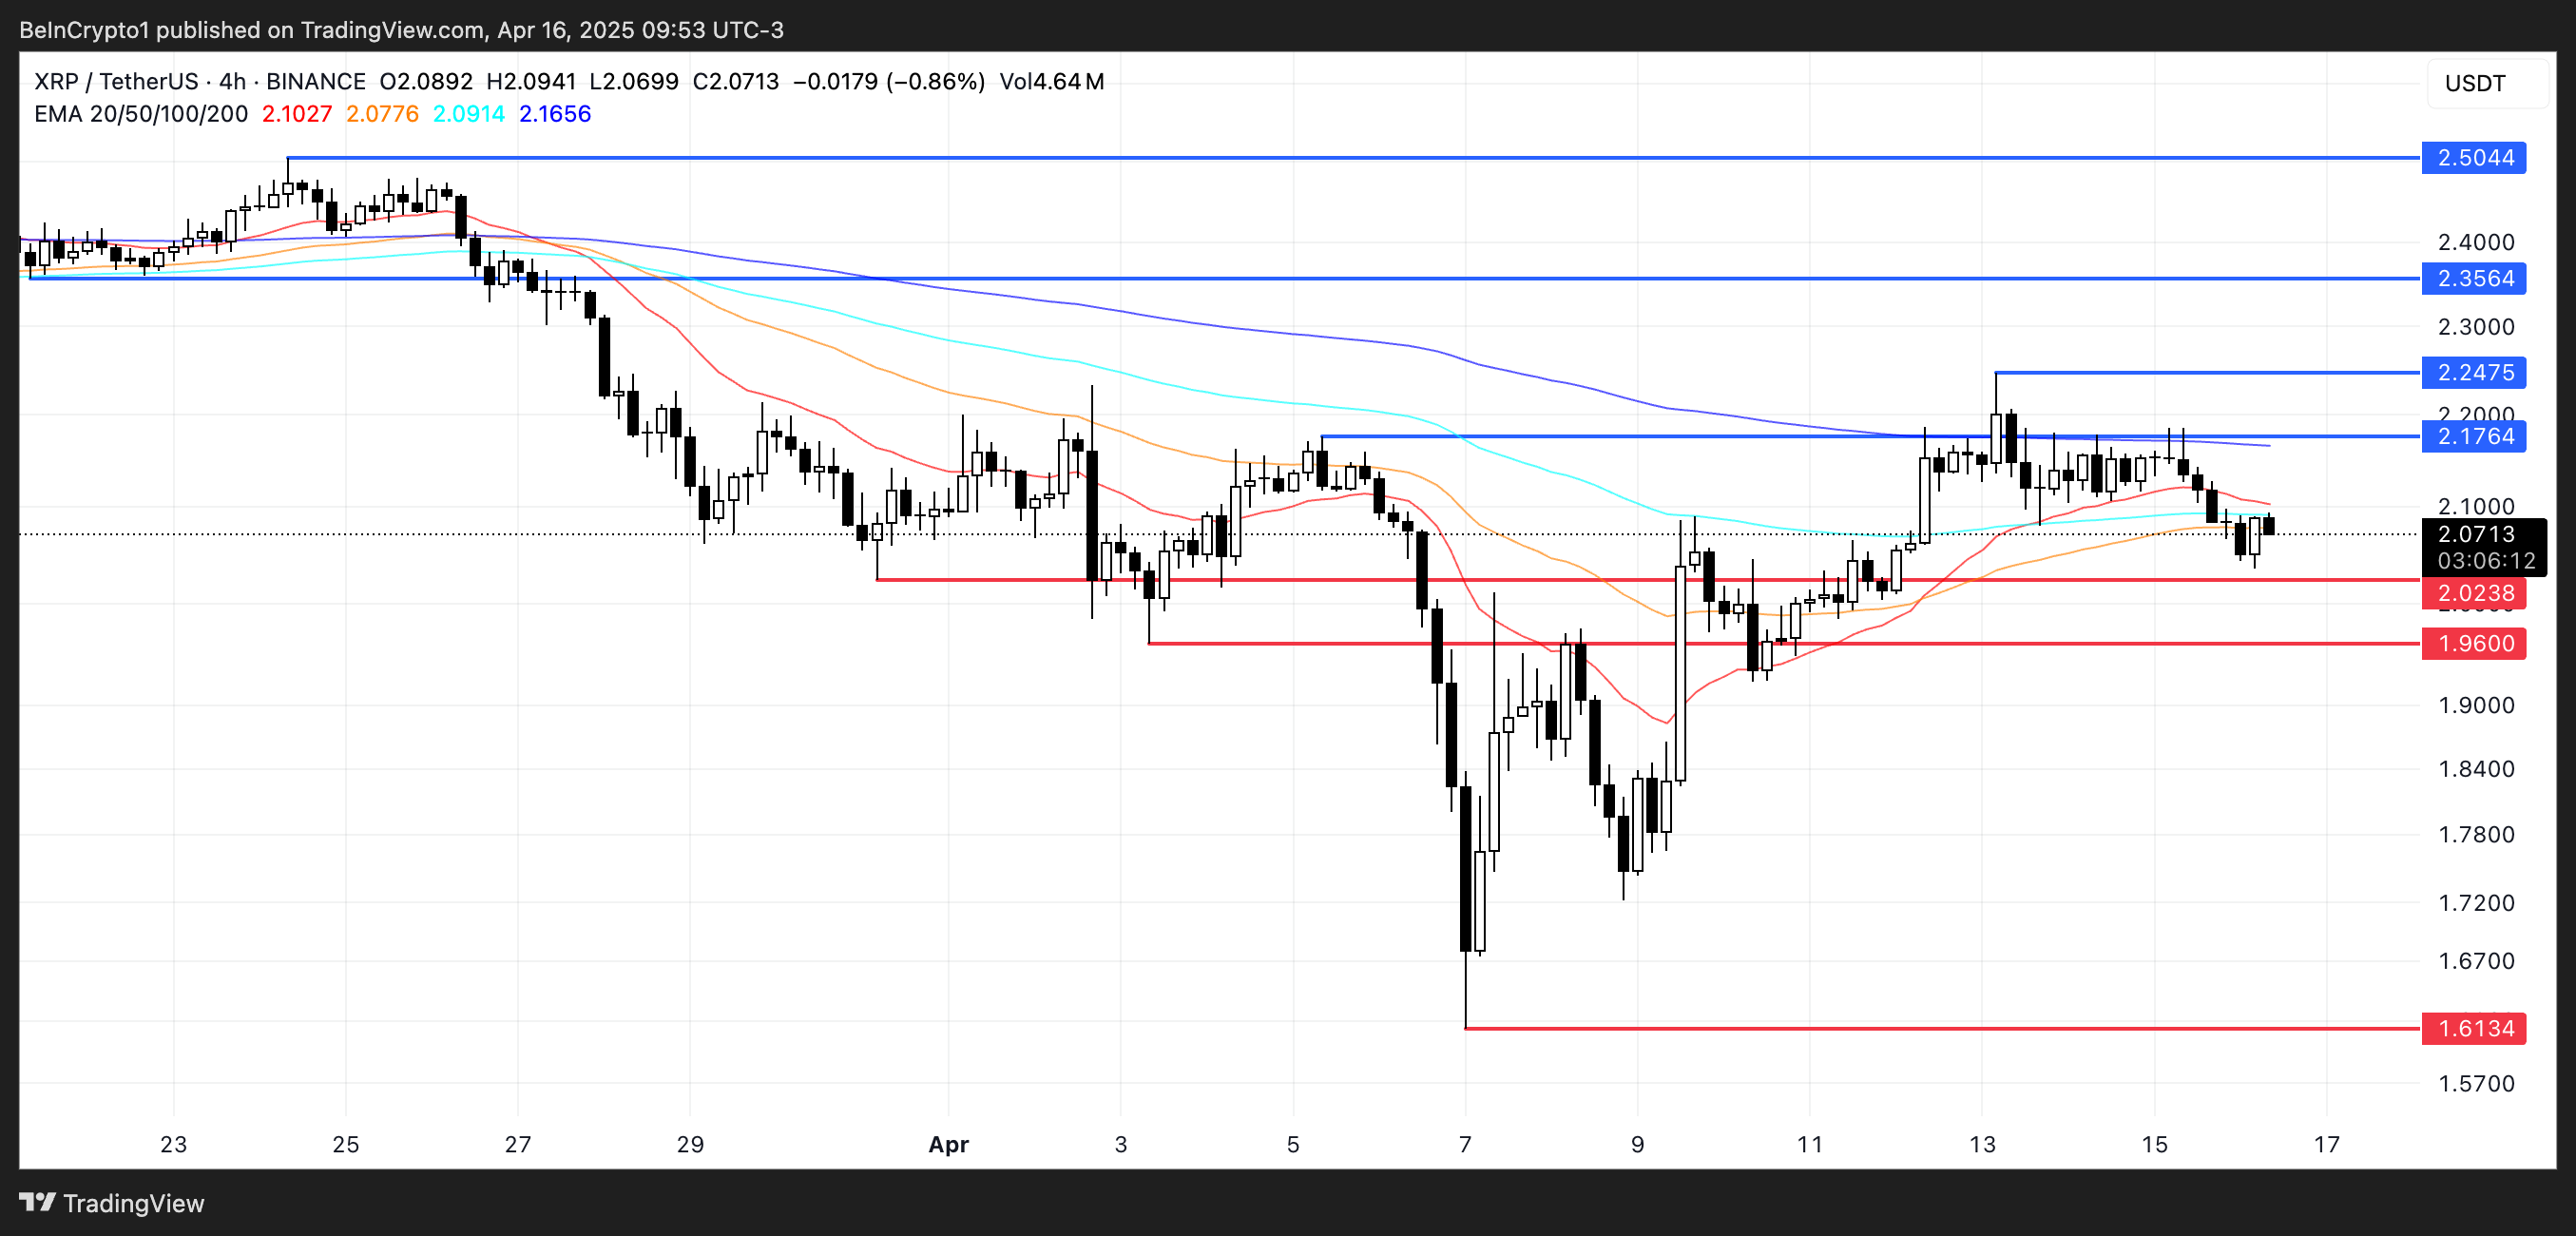
A death cross may form where the short-term moving average crosses below the long-term moving average. If confirmed, this could signal a deeper correction and suggest that XRP might retest support levels at $2.02 and $1.96.
A drop below these levels could see it fall to $1.61. However, if buying pressure recovers above $2.17, the next resistance at $2.24 would be the primary target.
Clearly breaking this could trigger a strong rally, and if momentum accelerates, XRP could rise to $2.35 or even $2.50.


