

Ethereum (ETH) is entering an important week as technical signals, on-chain data, and major upgrades converge. The Pectra upgrade scheduled for May 7th aims to improve staking and wallet functionality, but short-term volatility is expected during the release.
Meanwhile, ETH's BBTrend is located at 1.22, showing initial upward momentum but not yet strong enough to confirm a breakthrough. Whale activity remains near 5,463 addresses, with the price trading in a narrow range between $1,828 and $1,749. This sets the stage for a potential breakthrough or decline.
Ethereum Pectra Upgrade on May 7th... What to Expect?
The anticipated Ethereum Pectra upgrade will go live on May 7th, introducing 11 new Ethereum Improvement Proposals (EIPs). EIP-7251 aims to simplify validator operations and increase staking efficiency by raising the staking limit from 32 ETH to 2,048 ETH.
The upgrade also includes wallet improvements focused on user experience, potentially promoting dApp adoption through easier recovery and gasless transactions. This could increase ETH demand long-term, but may cause short-term volatility as exchanges might temporarily suspend ETH transfers during deployment.
While the upgrade promises significant improvements, it has been delayed multiple times due to long-term testing on networks like Holesky and Sepolia. A smooth release could boost confidence and price, but technical issues might trigger negative market reactions.
ETH Trend Signal 1.22... Early Uptrend or Noise?
Ethereum's BBTrend indicator is positioned at 1.22, indicating a weak upward bias. Over the past day, BBTrend reached a high level of 2.23, showing strong momentum before slightly retreating.
The current value has cooled but remains positive, suggesting the uptrend has not been invalidated. Traders are watching to see if BBTrend will rise again to confirm new strength or if momentum will continue to weaken.
BBTrend (Band-Break Trend) is a volatility-based indicator designed to detect trend strength and direction. Values above 1.00 typically indicate an uptrend, while values below -1.00 suggest a downtrend.
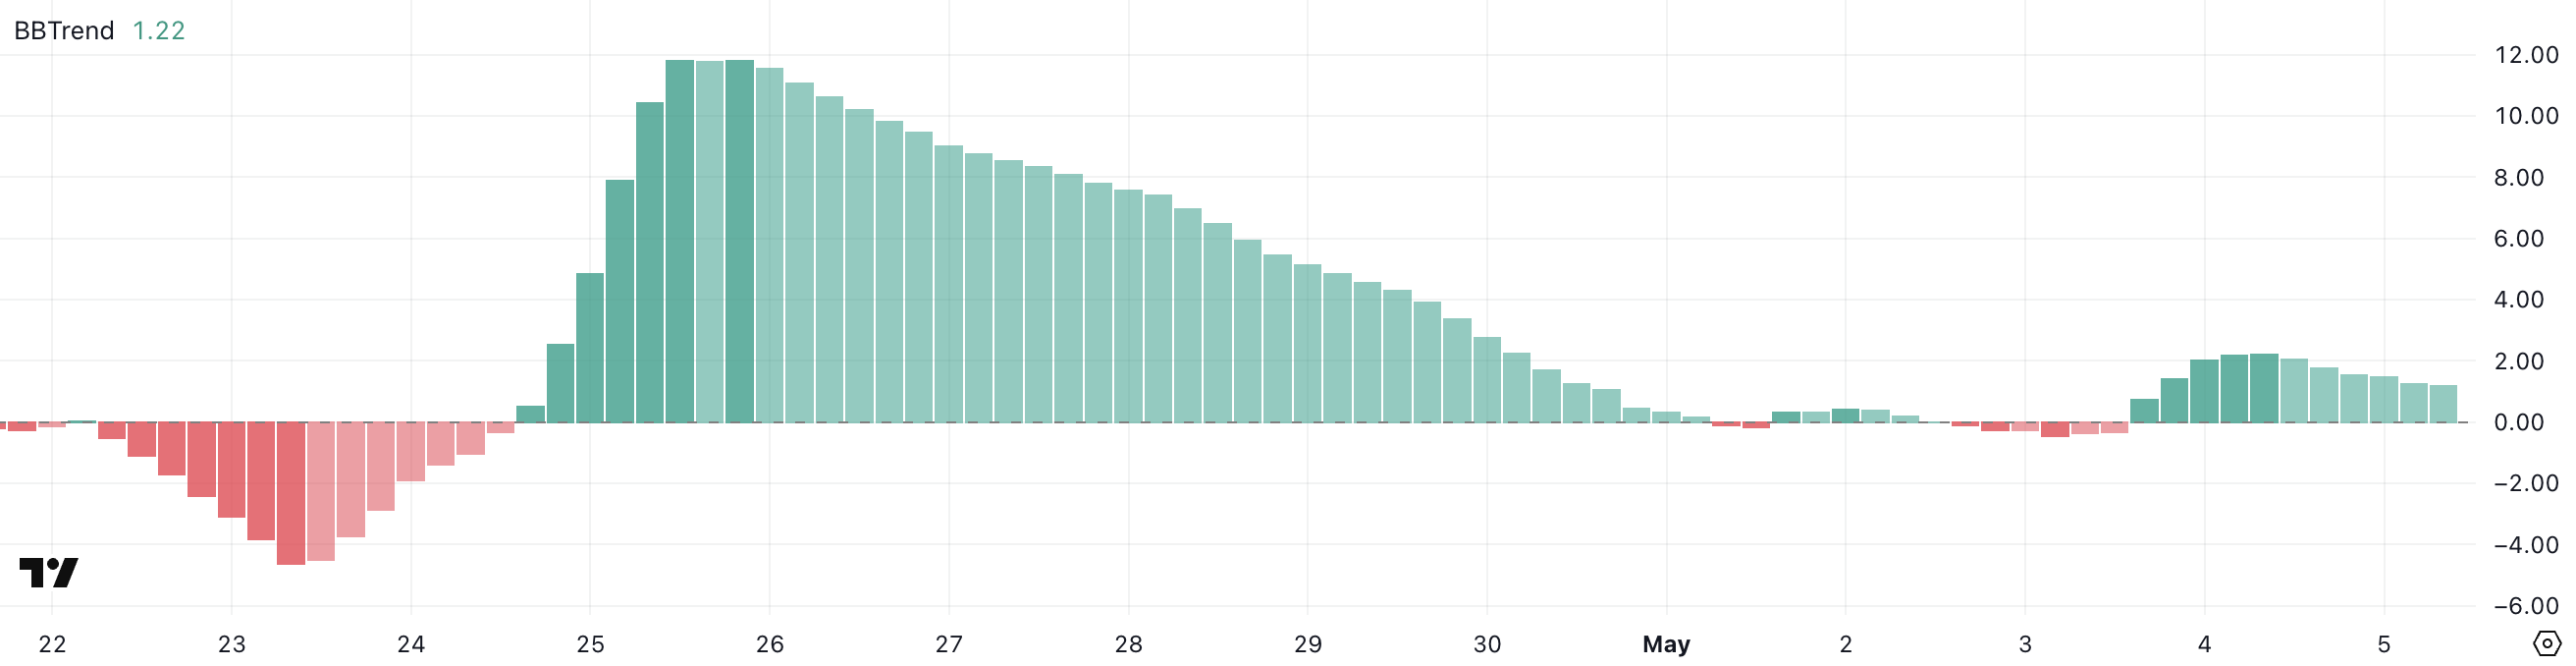
Values between -1.00 and 1.00 are neutral or indicate no trend, suggesting sideways movement or weak conviction. The further BBTrend moves from zero, the stronger the trend, with values like 2.23 warranting trend confirmation attention.
With ETH's BBTrend at 1.22, the indicator suggests a weak but positive trend, implying Ethereum might be entering the early stages of an uptrend.
However, this is not a strong breakthrough level, so the price could reverse if selling pressure increases or momentum weakens.
Rising above 2.00 would likely confirm continued upward momentum, while falling below 1.00 could signal a correction or even transition to bearish conditions.
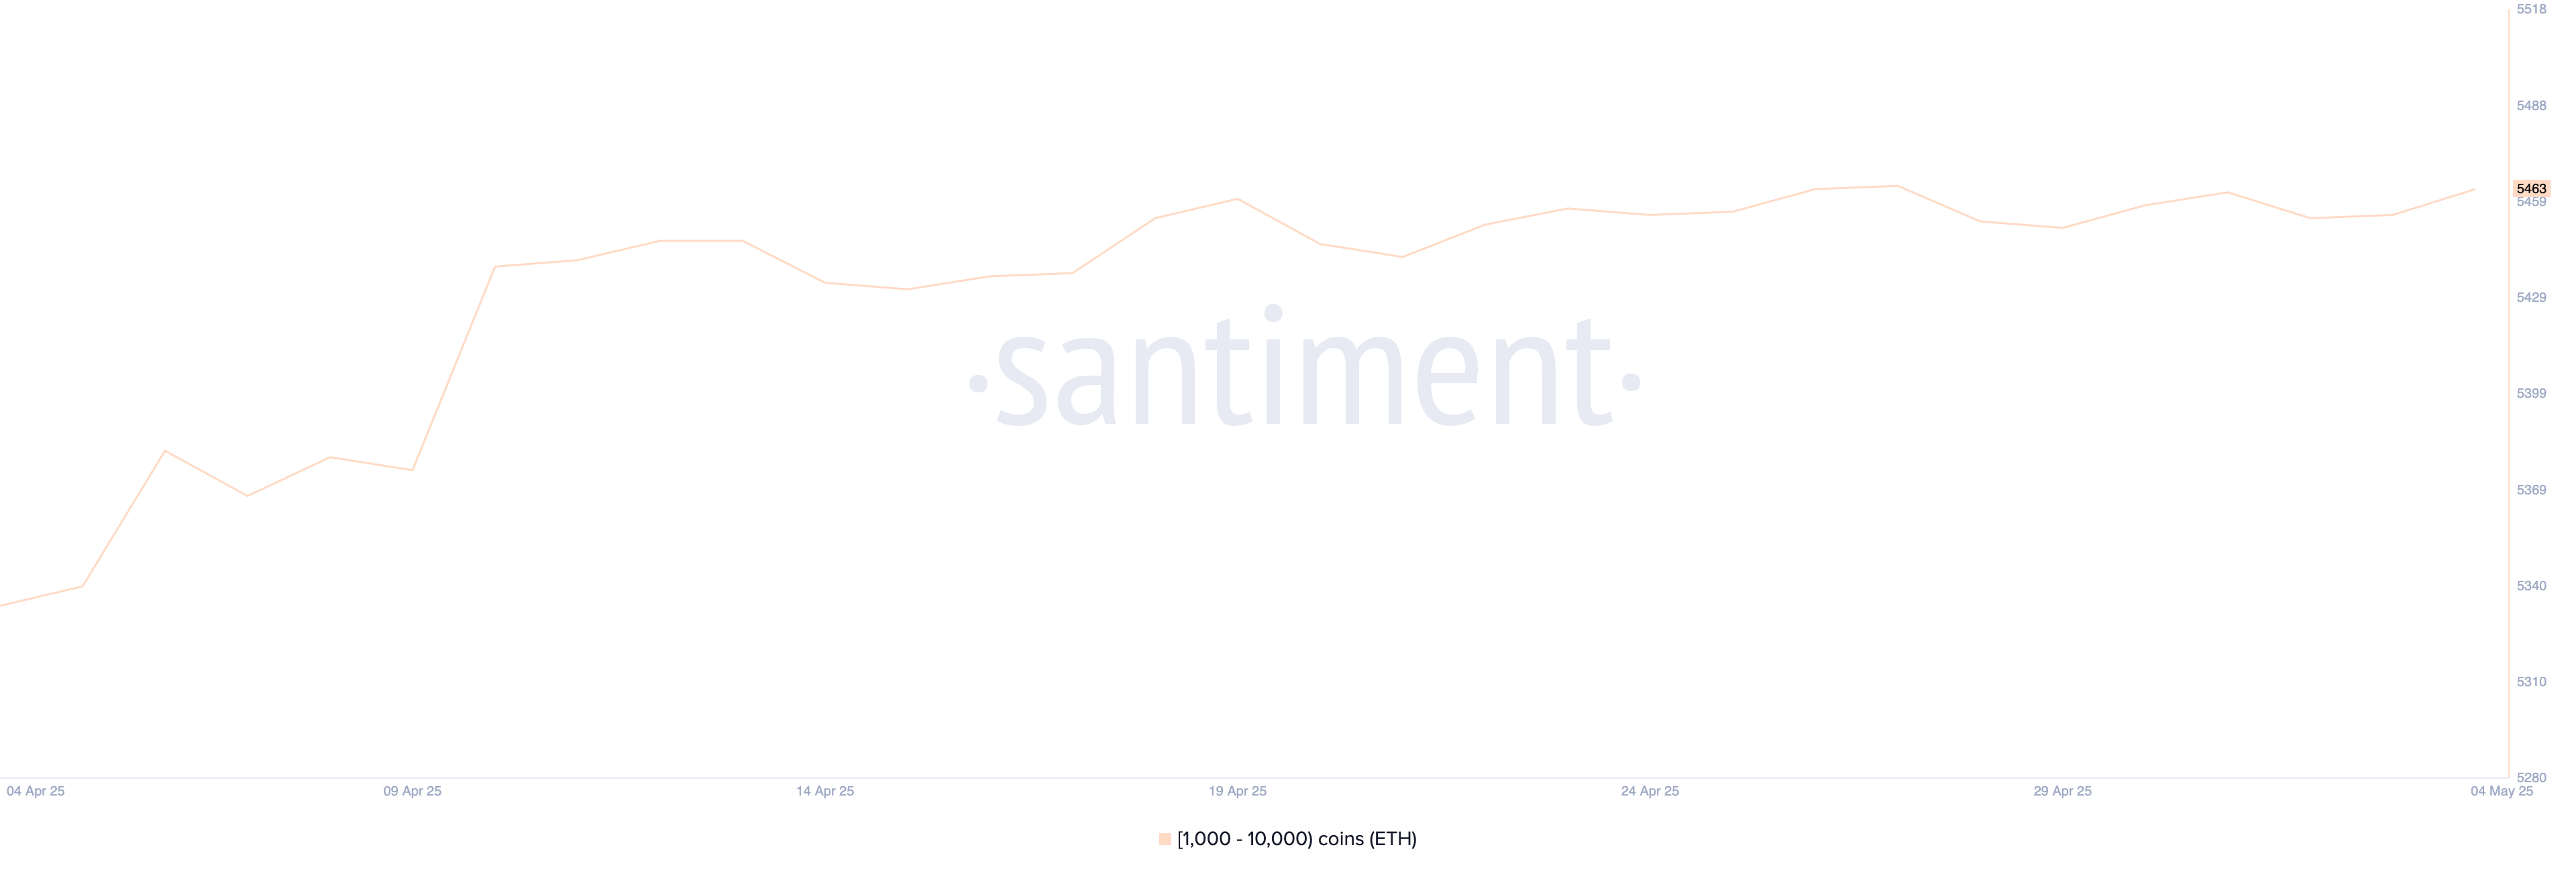
Looking at the broader picture, Ethereum whales—addresses holding 1,000 to 10,000 ETH—currently number 5,463.
This figure has experienced fluctuations in recent weeks without decisively increasing. Whale activity is a crucial on-chain signal, as these large holders often influence price movements through accumulation or distribution. Stable or increasing whale numbers typically indicate confidence and long-term accumulation, which could support ETH's price.
Conversely, continued stagnation or decrease in whale numbers might reflect hesitation among major investors, potentially limiting upward momentum.
ETH Trapped in a Box... Awaiting Breakthrough or Decline
Ethereum's price has been trading between the $1,828 resistance and $1,749 support since April 21st. This range has been maintained for over two weeks, showing market uncertainty.
Moving averages remain bullish, with short-term averages higher than long-term averages. However, they are beginning to converge and a death cross might soon form.
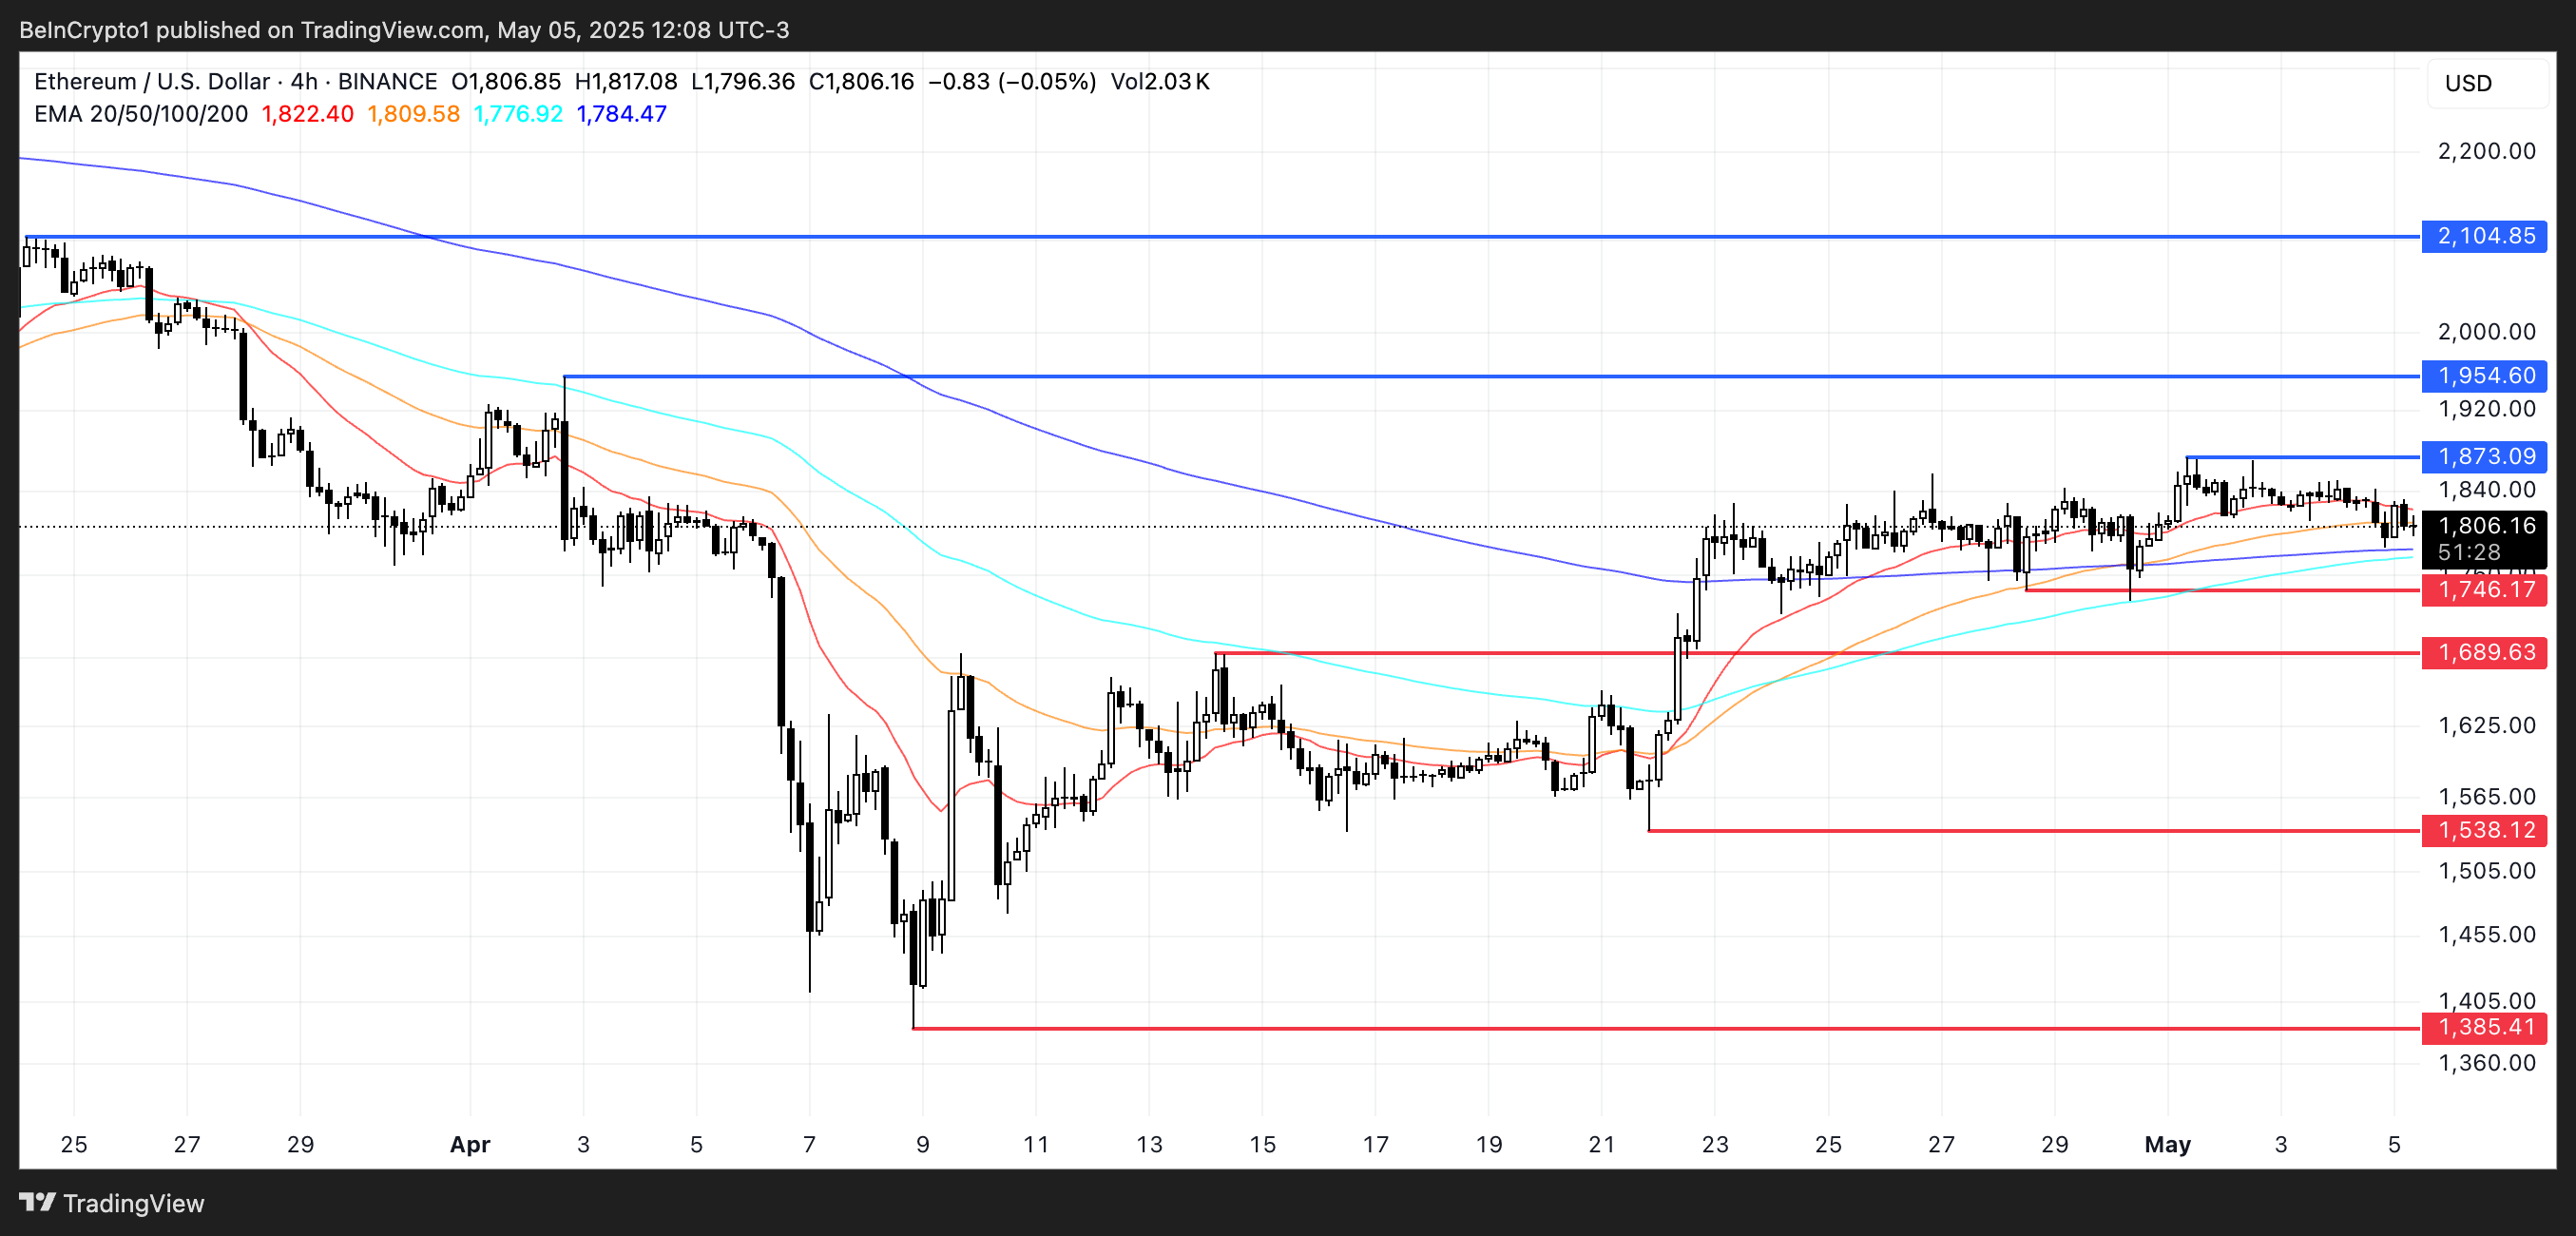
If the $1,749 support breaks, ETH could decline to $1,689. If the downtrend intensifies, targets like $1,538 and $1,385 could become important.
On the upside, if ETH breaks through $1,873, it could rise to $1,954 and potentially reach $2,104, recovering the $2,000 level for the first time since March 27th.


