Bitcoin and Ethereum Market Analysis on August 2nd: BTC, ETH Highlights Today
Market Review
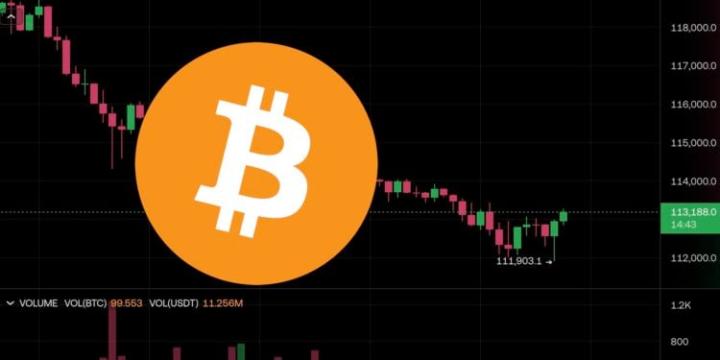
Yesterday, BTC continued to decline, with a significant drop in the early morning. Without clear negative news, a wash and reset might be more likely. The 4-hour chart entered the oversold zone, with attention on potential rebounds. The daily trend's downward momentum is amplified, awaiting recovery. The weekly trend shows some restoration, focusing on fundamental information, Federal Reserve interest rate cuts. Intraday expectations include an oversold rebound, with the possibility of a new weekly upward cycle starting
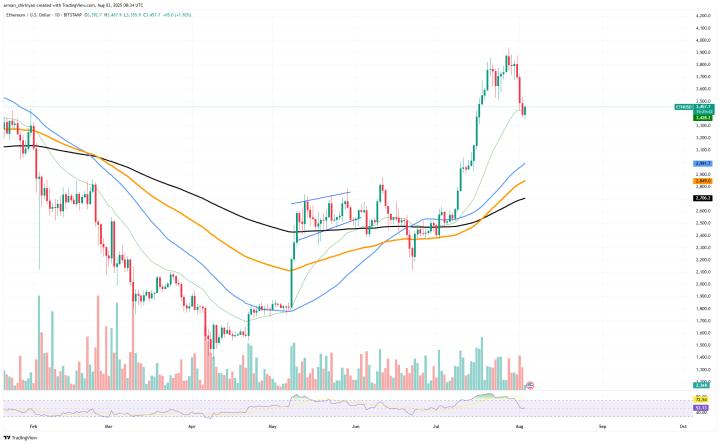
The secondary market followed BTC's synchronized decline. The 4-hour chart broke through the oscillation interval, with amplified downward momentum. Monitoring volume changes and awaiting recovery. The daily trend has broken position, focusing on 4-hour trend changes, with intraday expectations of an oversold rebound
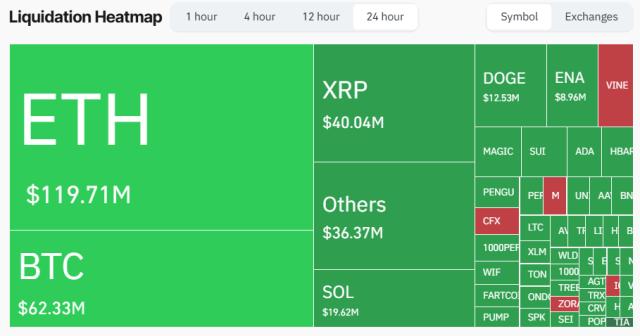
Altcoins synchronized decline with mainstream cryptocurrencies. The altcoin index returned to a lower level, with market sentiment again depressed. Monitoring BTC market dominance, fiat buying signals, and judging altcoin startup signals. ETH-related coins are heavily influenced by ETH. PENDLE experienced significant pullback, potentially worth considering for accumulation and waiting for a rebound. Recent Binance activities have been frequent, with ongoing Alpha point events. Points can be accumulated, and there are numerous opportunities for rewards
Today's Highlights:
BTC is in the oversold zone at 1-hour and 4-hour levels, returning to normal on the daily chart. Intraday expectations include an oversold rebound. Intraday support is 112,500-113,000, with resistance at 115,000-116,000
ETH is in the oversold zone at 1-hour and 4-hour levels, below healthy levels on the daily chart. Intraday expectations include an oversold rebound. Intraday support is 3,400-3,450, with resistance at 3,600-3,650