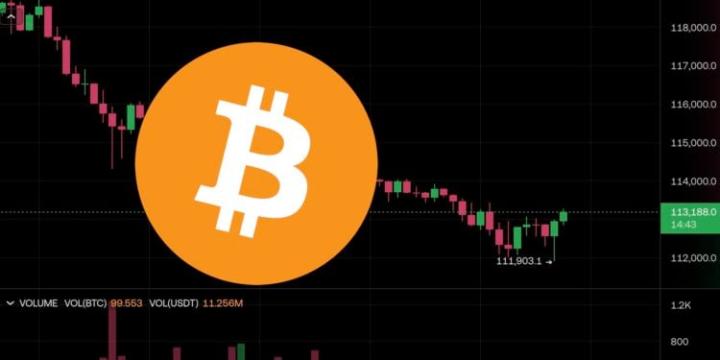
Last weekend, Bitcoin's liquidity faced a severe challenge as an early large-scale investor sold over 80,000 BTC through Galaxy Digital's over-the-counter trading service. Despite the selling pressure of nearly $9.6 billion, the market quickly absorbed the massive sell-off, with prices briefly dropping to $115,000 before quickly stabilizing at $119,000, slightly below the historical high.
VX: TZ7971
Even after such a large-scale selling event, the unrealized profits held by market participants remain substantial. Currently, the total unrealized profit is as high as $1.4 trillion, with 97% of the circulating supply still in a profitable state.
According to multiple on-chain valuation models, Bitcoin's price is currently oscillating in the range of $105,000 to $125,000. If an effective breakthrough occurs, the price may further explore $141,000, where significant selling pressure is expected due to anticipated unrealized profit realization.
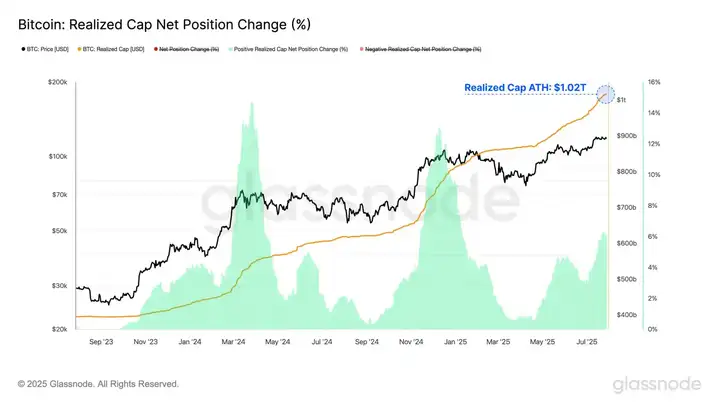
The recent surge in profit-taking has dramatically accelerated the Realized Profit/Loss Ratio, with current realized profits reaching 571 times the losses. This value is at an extremely high level, with only 1.5% of trading days historically exceeding this level.
However, interpreting this signal requires caution. While extreme profit-taking may accompany price tops (as seen during the $73,000 historical high on March 7, 2024), this is not an immediate reflection. For example, when breaking $100,000 in late 2024, the profit-taking peak occurred at $98,000, but the market subsequently rose 10% to $107,000 before topping.
This lag indicates that significantly elevated profit-taking often signals (but does not immediately cause) market exhaustion. It creates supply pressure that takes time to digest, with market reactions potentially having a delay.
After digesting a large number of long-dormant tokens, the Long-Term Holder Net Realized Profit/Loss reached a historical high of $2.5 billion, surpassing the previous peak of $1.6 billion. This marks the largest single selling pressure event in Bitcoin's history, an extreme liquidity stress test, but the market demonstrated remarkable resilience, with prices consistently oscillating near historical highs.
This further confirms Bitcoin market's extraordinary ability to withstand major distribution events, having already witnessed tests such as Mentougou compensation and German government sales in this cycle.

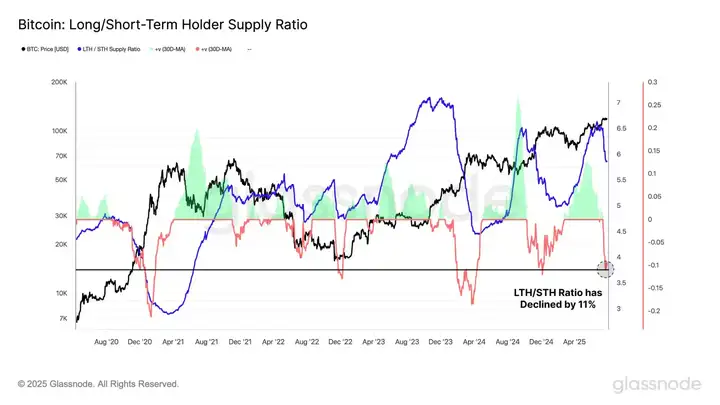
By comparing the supply ratio of long-term and short-term holders, it can be seen that the same pattern occurred during the three historical highs in this cycle: after initial accumulation, there is always a sharp transition to aggressive distribution.
The current distribution phase continues, with the LTH/STH supply ratio continuously shrinking. Over the past 30 days, this ratio has dropped by 11%, with only 8.6% of trading days showing a more drastic decline, highlighting the intensity of investor behavior changes.
Market Cost Analysis
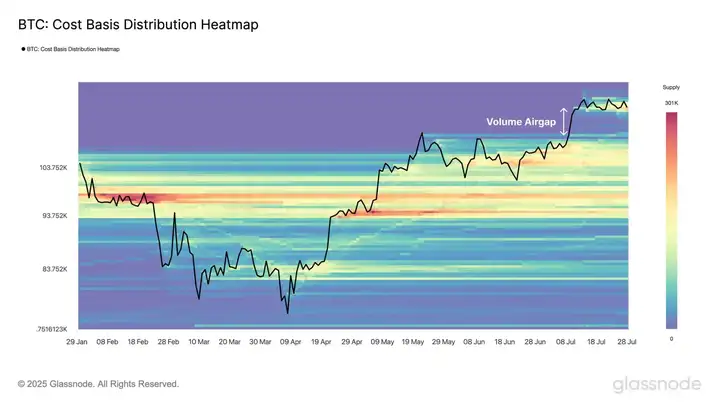
The Bitcoin cost basis distribution chart shows a significant cost basis aggregation in the $117,000-$122,000 range. This indicates that many investors completed accumulation in this high-price zone.
Notably, there is a trading volume vacuum zone below the spot price in the $110,000-$115,000 range, resulting from the rapid price surge without sufficient turnover. Not all vacuum zones require filling, but this area has price gravity, and the market may need to test the effectiveness of this support, making it a key area to watch during a pullback.
From a macro perspective, Bitcoin may maintain an oscillation between $105,000 and $125,000 before a decisive breakthrough. If an effective breakthrough occurs, the $141,000 region (corresponding to the +2σ interval) may become the next strong resistance level, where on-chain indicators suggest selling pressure may sharply increase.
The low-volume area below $110,000-$115,000 is worth close attention, and if a pullback occurs, this area will become a critical observation point.
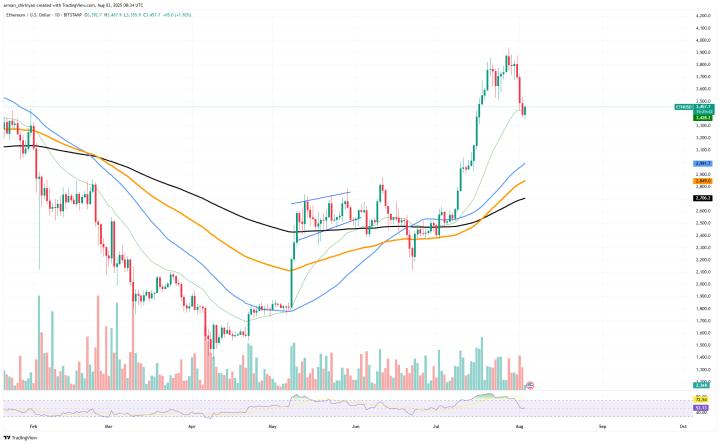
This pullback has essentially cleared out the bulls. Currently, fund sentiment is gradually turning conservative, with ETF flows diverging, whales frequently repositioning, and continuous macro policy disruptions. Amid these intertwined variables, the market is increasingly showing a thick defensive sentiment. After Bitcoin just experienced a massive profit-taking wave, such large-scale profit-taking selling pressure usually requires the market to consolidate for a period before ushering in a new wave of growth. Uncertainties in the US economy have re-emerged, with Trump's proposed new tariff measures casting a shadow over global risk assets. Bitcoin's price trend may continue to oscillate, primarily driven by capital rotation. Currently, the SOL ecosystem and Ethereum ecosystem are good layout points.


