

Layer-1 (L1) blockchain network Solana showed a notable increase in user demand in April. This surge in activity is clearly reflected in key indicators, including daily transactions, fees, and revenue.
This led to a surge in demand for SOL, causing its price to rise by 16% over the past 30 days. As the network shows no signs of slowing down, SOL may continue its upward trend in the short term.
Solana Network Activity Explodes…SOL Price Rises
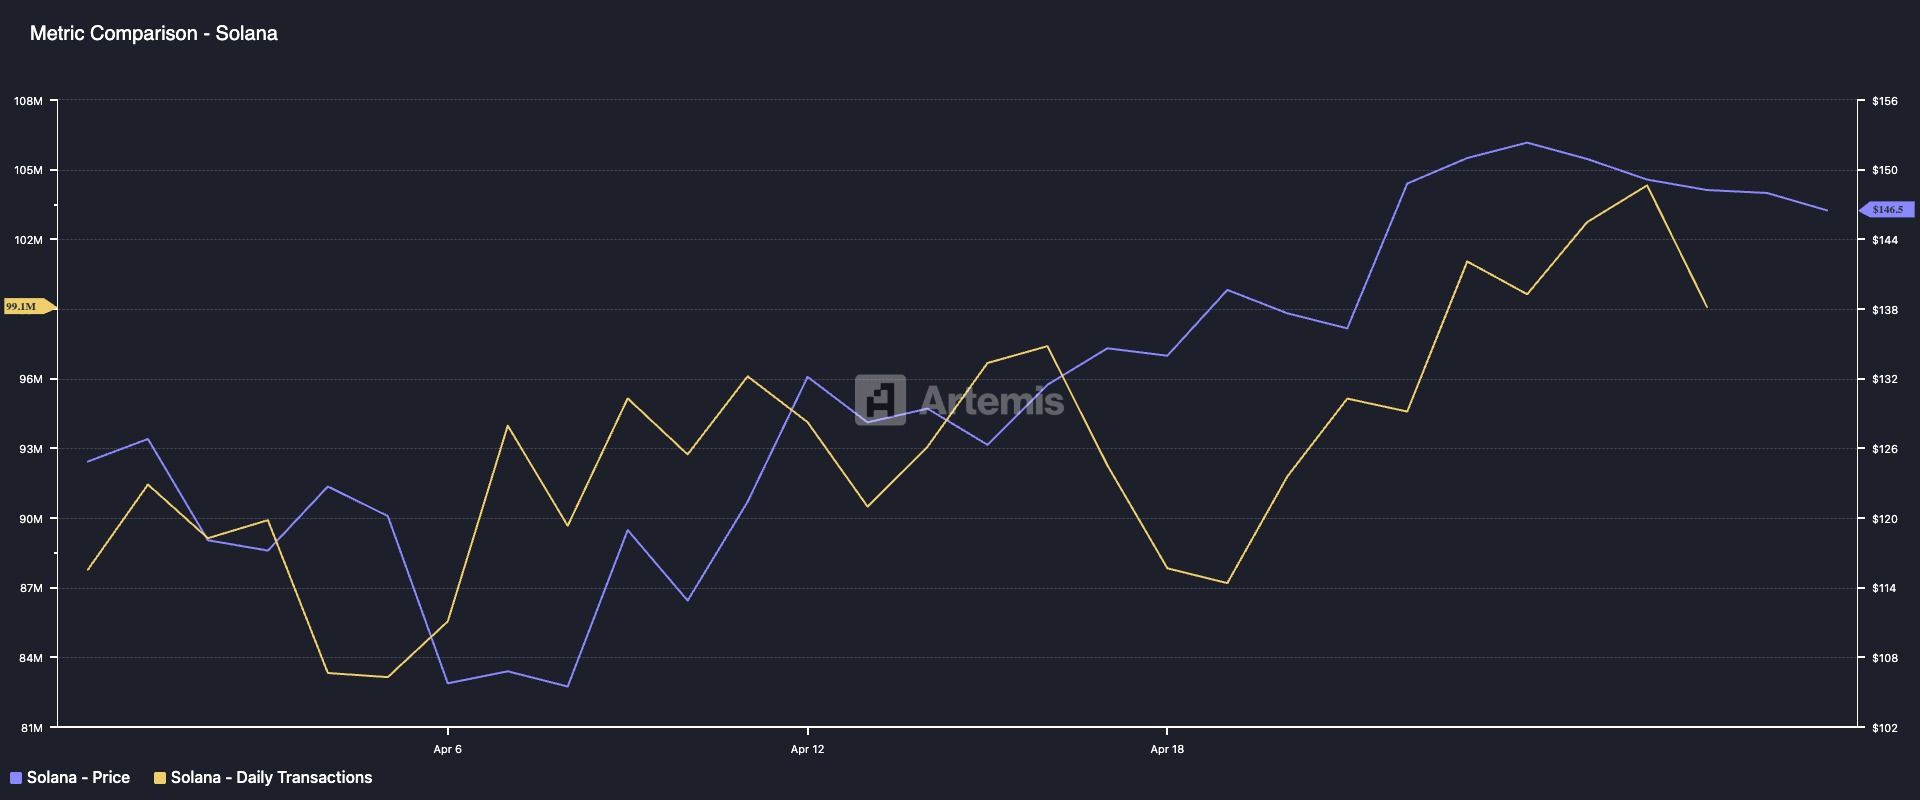
The increase in Solana's user activity this month is evident in the growth of daily transaction numbers. According to Artemis data, the network has processed over 99 million transactions since early April, representing a 12% increase in daily transactions compared to the previous month.
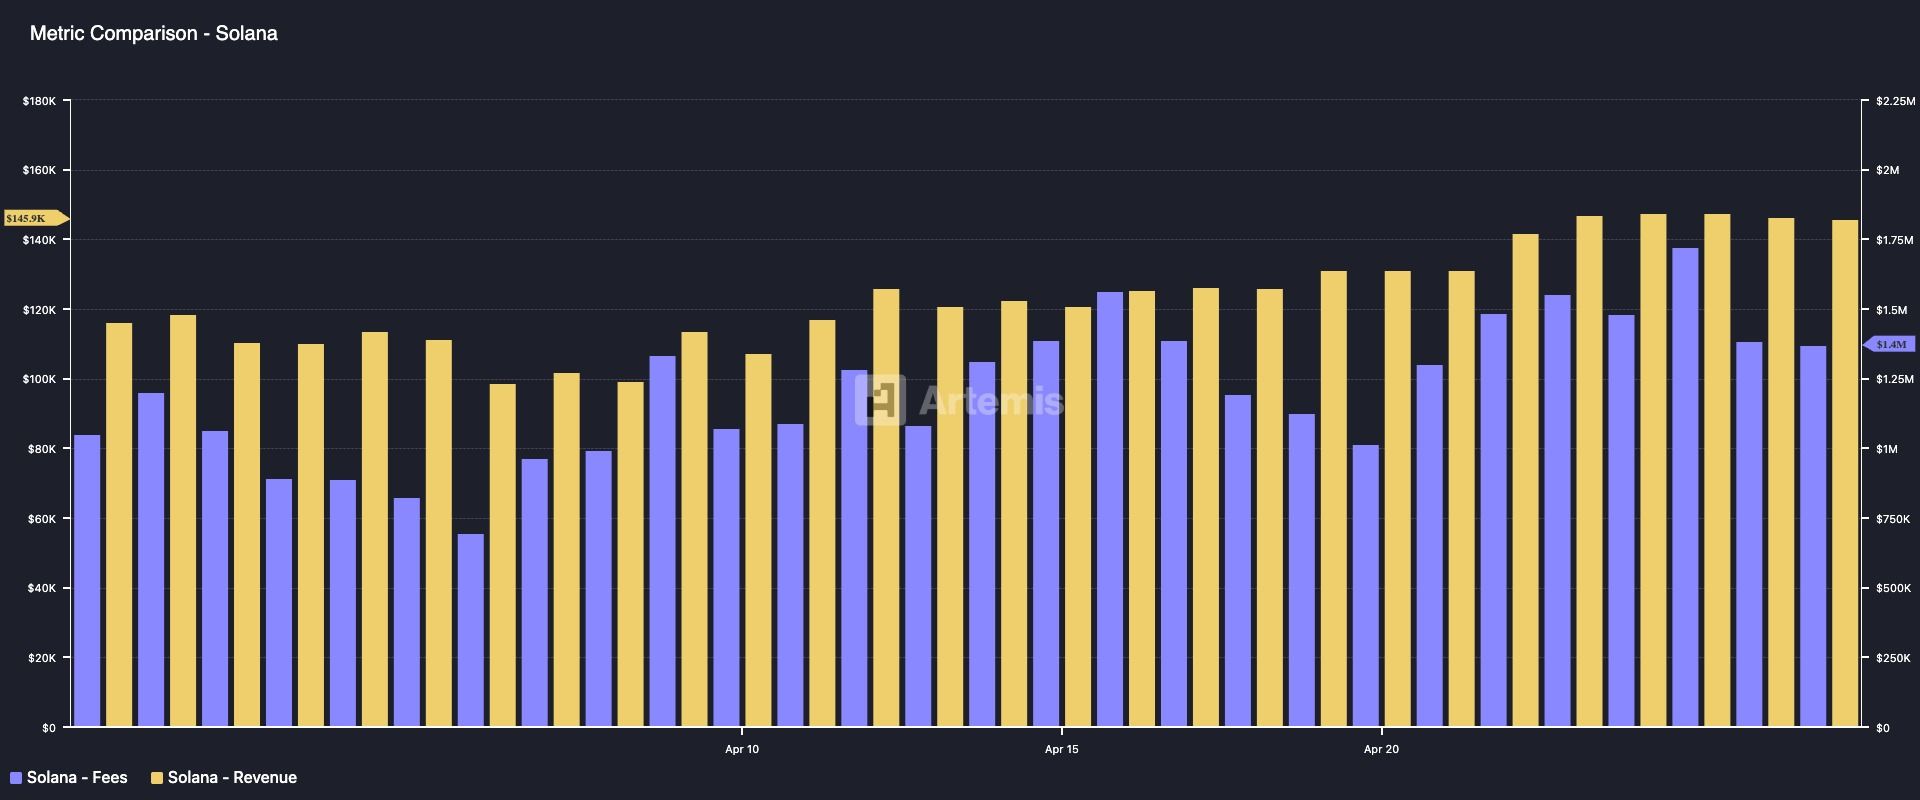
This increase in user engagement has led to a noticeable rise in Solana's network fees and resulting revenue. According to Artemis, the network's transaction fees surged by 35%, and revenue from fees increased by 26% during the same period.
The surge in user activity across the Solana network has triggered demand for its native token, SOL. This is because more users need SOL to facilitate transactions and pay network fees as they interact with the L1 platform.
This resulted in a double-digit price increase, with SOL rising by over 16% last month. The price increase reflects growing investor confidence in the network and highlights the positive correlation between user activity and token value.
Therefore, if Solana's user activity remains high, SOL could maintain its upward trend in the new month.
SOL Shows Ambiguous Momentum…Could Drop to $120 if Trend Breaks
The Directional Movement Index (DMI) reading on the daily chart confirms buying pressure among spot market participants. At the time of reporting, SOL's positive directional index (+DI, blue line) is positioned above the negative directional index (-DI, orange line).
The DMI indicator measures the strength of an asset's price trend. It consists of two lines, with +DI indicating upward price movement and -DI representing downward price movement.
Like SOL, when +DI is positioned above -DI, the market is in an uptrend, and upward price movement dominates market sentiment. If this continues, SOL could extend its rally and rise to $171.88.
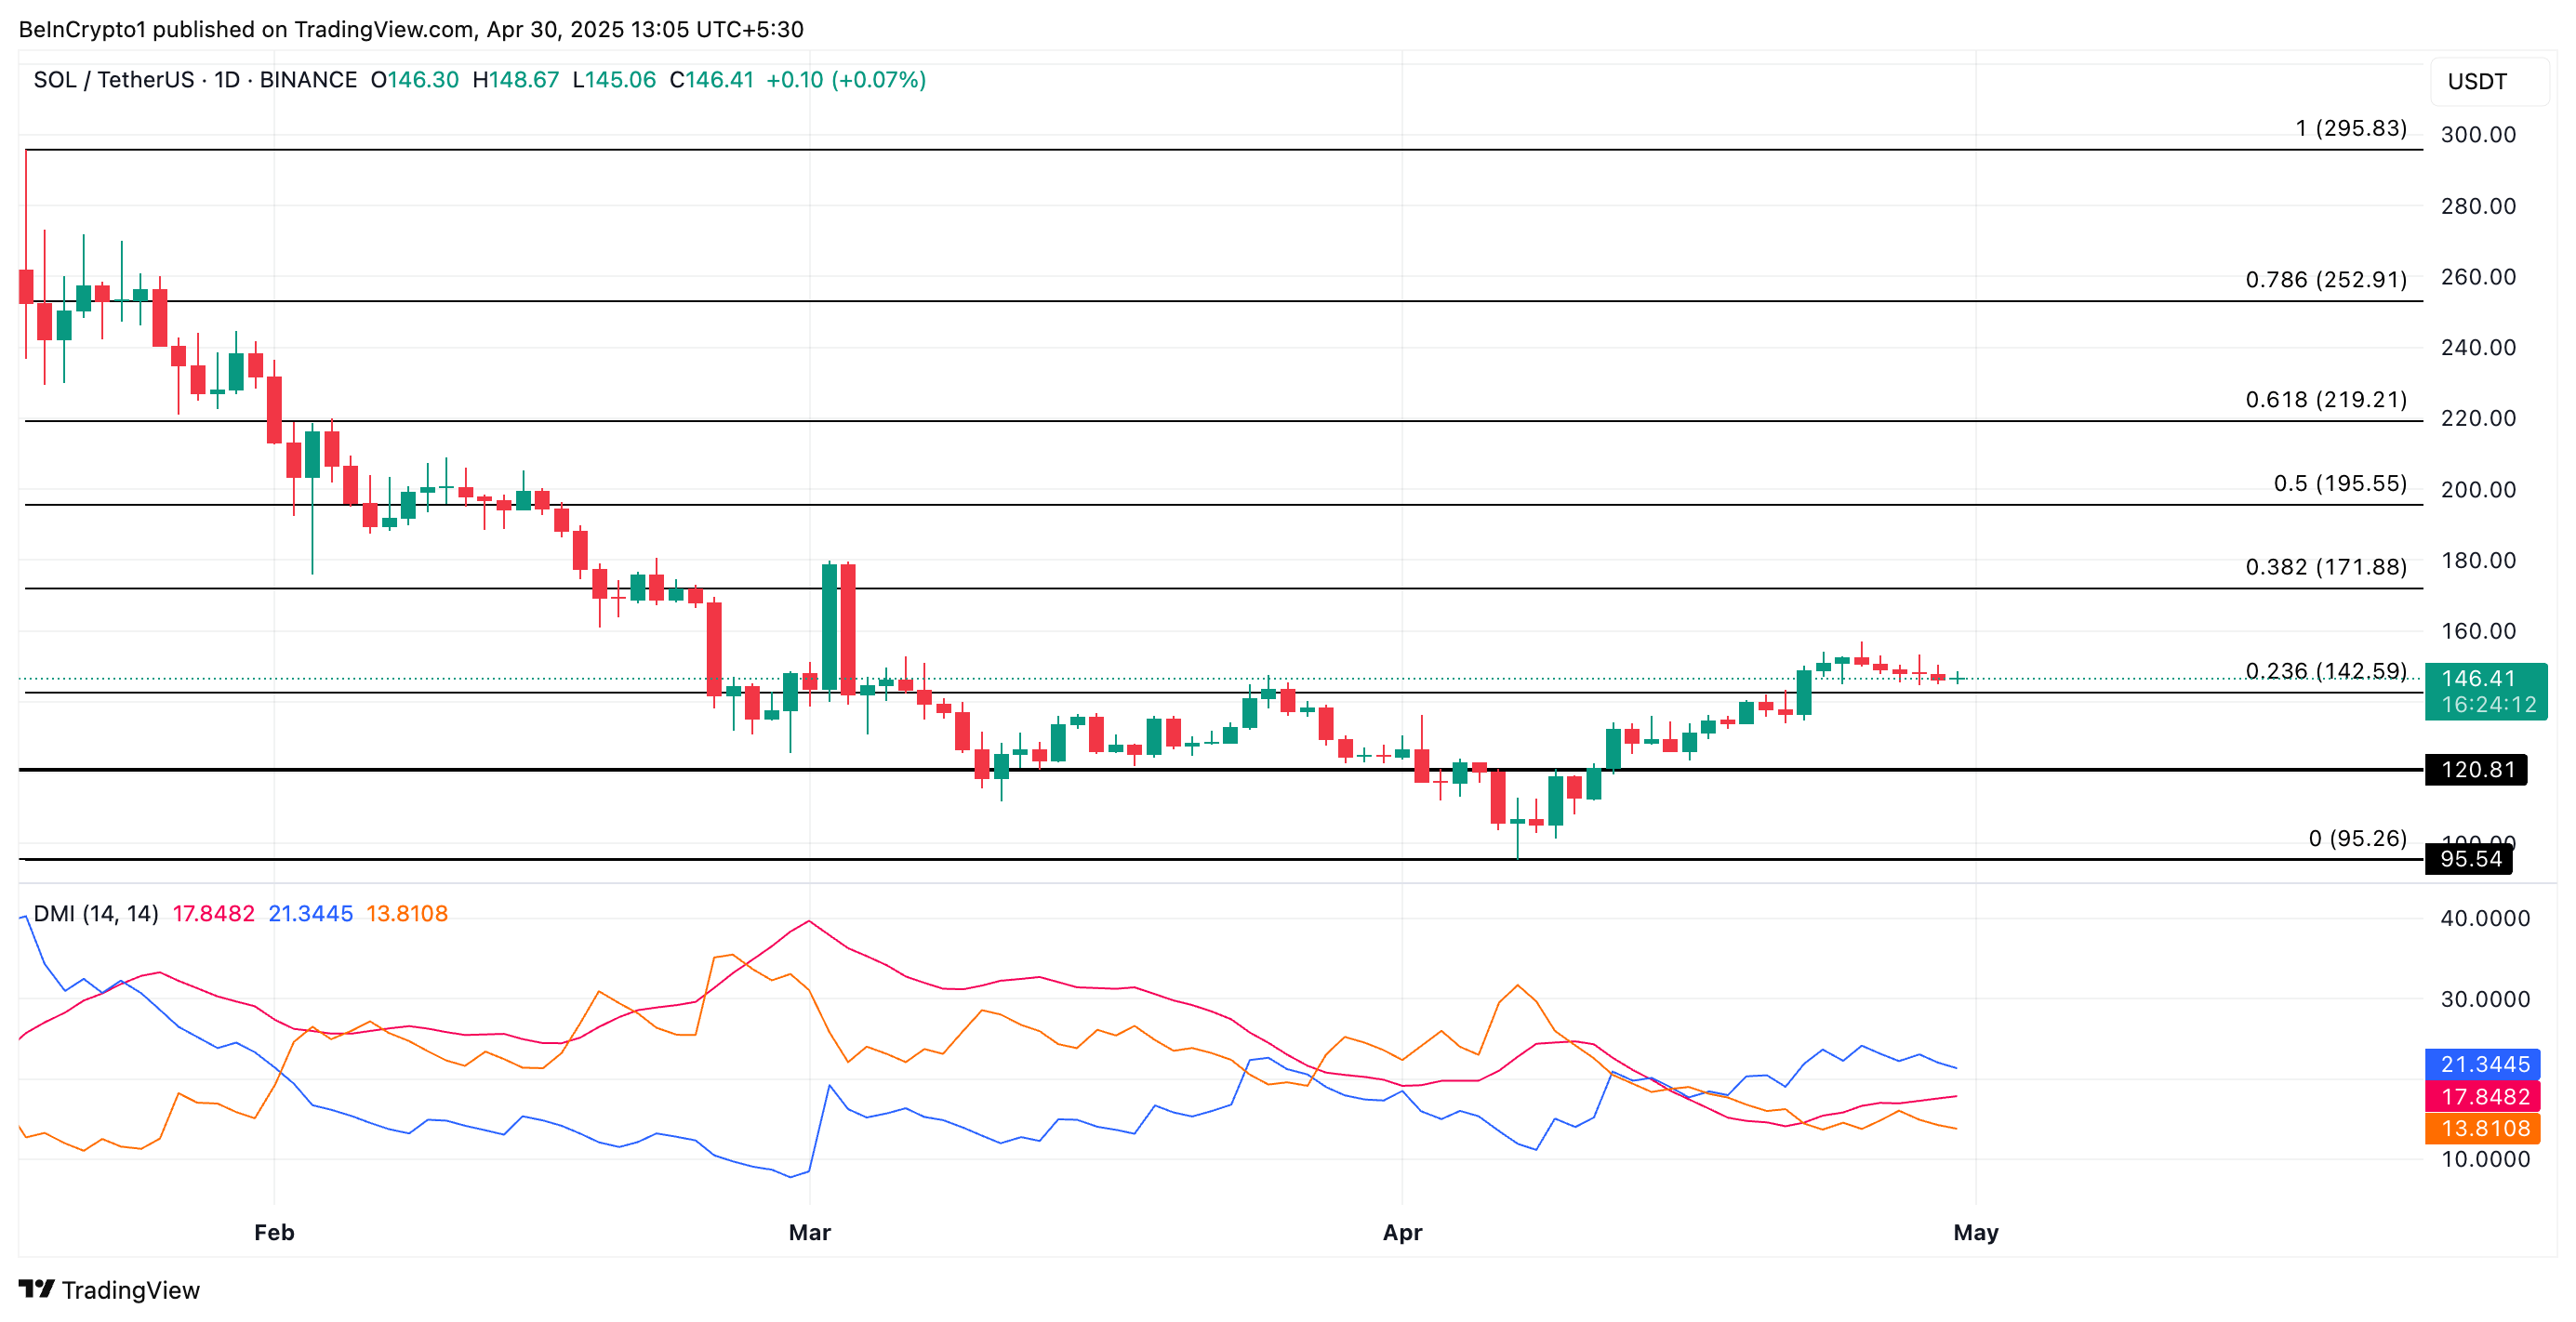
However, if Solana's user activity decreases and impacts demand for SOL, the coin's price could lose its recent gains and drop to $120.81, falling below the support level of $142.59.


